Building a Better Tech Radar
How Zalando helps its engineering teams navigate the tech landscape

Software Architect
How Zalando helps its engineering teams navigate the tech landscape
Zalando has more than 200 engineering teams, which regularly face tricky technology choices. To help them make good decisions, we created the Zalando Tech Radar as a "navigation" tool. Inspired by ThoughtWorks, it assigns each technology to one of four rings — Adopt, Trial, Assess and Hold — which represents the current consensus within Zalando. At the same time, the Tech Radar also serves as platform to share experience around relevant technologies and as a public showcase of technology adoption within Zalando.
The problem
How do you auto-generate a radar-like chart? At first, this seems trivial. Each technology (or "blip", in radar speak) is assigned to exactly one quadrant and one ring, resulting in 16 ring segments in total. But arranging blips inside each segment — in a way that looks "natural" — is surprisingly hard.
Our old approach
When we first published the Tech Radar in 2015, we researched how others had solved the layout problem, and found radar.js from Brett Dargan. This script uses polar coordinates, where each position is defined "by a distance from a reference point and an angle from a reference direction”. Polar coordinates make it easy to express the boundaries of ring segments in code. The script utilizes the popular D3.js library to render SVG — a vector graphics format that is supported by modern browsers.
So far, so good, but we still need to arrange blips inside each segment. We tried some heuristics like evenly spacing the blips, or alternating between two rows. But in the end, the layout either looked very rigid and artificial, had some blips overlapping others, or both. We fixed this by auto-generating the layout anyway, and then hand-tweaking selected coordinates.
A new hope
After fiddling with polar coordinates for two years, we decided that enough is enough. "This is ridiculous! There has to be a better way!" And indeed, the d3-force module provides "force-directed graph layout", where the layout of the graph is determined automatically, by simulating physical forces (like gravitation, cohesion or collision). Check out this cool example from Mike Bostock, or this step-by-step introduction.
So let's create a force-directed Radar layout! As it turns out, this works really great — except the challenge is now to keep each blip inside its segment.
Fencing with invisible blips
Our first idea was to use two kinds of blips:
- visible ones (representing technologies), which would be pushed around by forces
- invisible ones, which would be placed in fixed positions around the perimeter of each ring segment, and act like a fence:

This approach mostly works except that sometimes, when crowded, blips push each other so hard that one of them slips through the fence into the neighboring segment. Which completely ruins the visualization, of course, so we had to try something else.
The solution
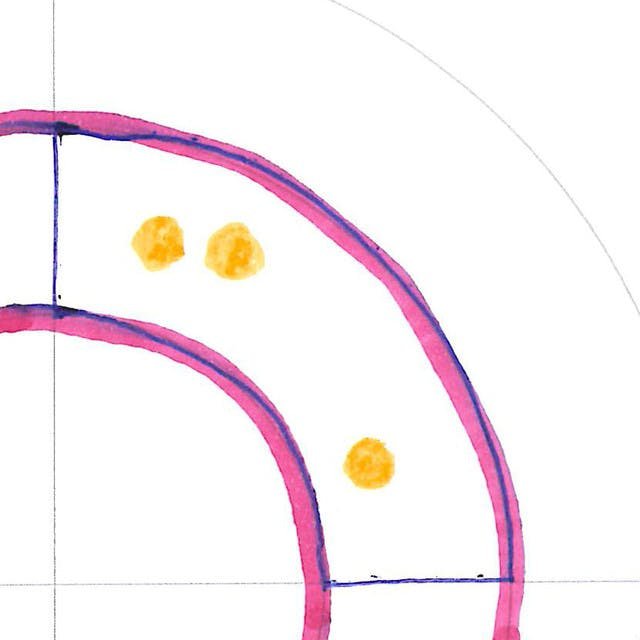
In the end, the best way to keep blips "inside the box", is exactly that: a bounding box, which is applied on each simulation step. Actually, after some experimentation we settled on two bounding boxes for each segment: one in Cartesian space (to keep blips inside their quadrant)...

... and one in polar space (to keep blips inside their ring):
So, to recap, we start by placing blips randomly into each ring segment. When we run the simulation, a collision force ensures that blips stay away from each other; and our bounding boxes make sure that no blip can escape. But, are we finished?
Almost
Repeat after me
Although the Radar visualization is created on the fly (you can actually see the blips moving, if you watch closely), we want the result to be identical if the page is reloaded. This is why we use a custom random number generator; essentially, a function that returns a fixed sequence of "randomish" numbers. This ensures that the simulation always produces the same result.
Ta-da!
And we are done: an auto-generated Radar visualization with "natural" spacing and without any overlaps, even in crowded ring segments:

We've even released the code on GitHub under MIT license. So feel free to go ahead and create your own Radar!
We're hiring! Do you like working in an ever evolving organization such as Zalando? Consider joining our teams as a Frontend Engineer!


