Experimentation Platform at Zalando: Part 1 - Evolution
Challenges and solutions of our experimentation platform at Zalando

Applied Scientist
Online controlled experimentation, aka A/B test, has been a golden standard for evaluating improvements in software systems. By changing one factor at a time, A/B test causally measures, from real users, whether one product variant is better than the other.
As an increasingly important area in tech companies, experimentation platforms face -- apart from their scientific challenges -- many unique engineering problems. In this blog series, we will share what we’ve learned at Zalando. During this journey, we have presented our works at well-known conferences including PyData 2018, Conference on Digital Experimentation 2018, and Causal Data Science Meeting 2020.
In this first post, we’ll introduce the evolution of experimentation platform at Zalando. Technical challenges and their solutions of experimentation engine, analysis system, data quality issues, and data visualization will follow in the upcoming posts.
The next sections are structured using the Experimentation Evolution Model in Fabijan et.al., 2017.
Phase one: crawl (before 2016)
As natural as data-driven decisions sound today, it’s not the focus in early stages of Zalando. In the early days, A/B tests are set up by each team individually and manually -- as well as their analyses.
Soon we discovered that such setup can neither ensure A/B test quality, nor can we know whether product teams actually run A/B tests before making decisions. There is very little A/B testing knowledge in most product teams then -- we realized the need of a centralized experimentation service. In order to take full control of data infrasture as well as analysis features, we need an in-house experimentation platform at Zalando instead of using off-the-shelf A/B testing tools.
In 2015, the first version of Zalando's Experimentation platform Octopus was released. It is named after Paul the Octopus, who correctly chose the winner team of a match at FIFA 2010, with a small error rate. That’s the essence of an experimentation platform, except that our metrics are based on trustworthy statistics rather than Paul’s mood of the day.
At this period, our biggest challenge is Lack of cross-functional knowledge. The initial platform was built by a virtual team with members from various parts of Zalando. The platform had three parts: experiment management, experiment execution, and experiment analysis. In the early days, the team's focus was set to execution because of few service customers - analyses can be performed manually in the worse case. This initial virtual team consisted of engineers and data scientist who had little knowledge of each other's domain at that time. For example, data scientists didn't have production software experience and didn't know Scala, whereas software engineers didn't know concepts of statistics. To decouple the development processes of one subgroup from another, we ended up with building an open-source statistics library wrapped by the backend production system.
Phase two: walk (2016-2020)
Even though wrapping analysis scripts into a production software system is not a scalable solution, it worked for the load at that time. Through hard groundwork, we achieved a platform where teams can configure and manage their A/B tests in one place. Another major benefit of platformization is that randomization process and analysis methods are now standardized. Octopus uses a two-sided t-test with 5% significance level to analyze results.
During these years, we have boosted the number of running A/B tests at Zalando.
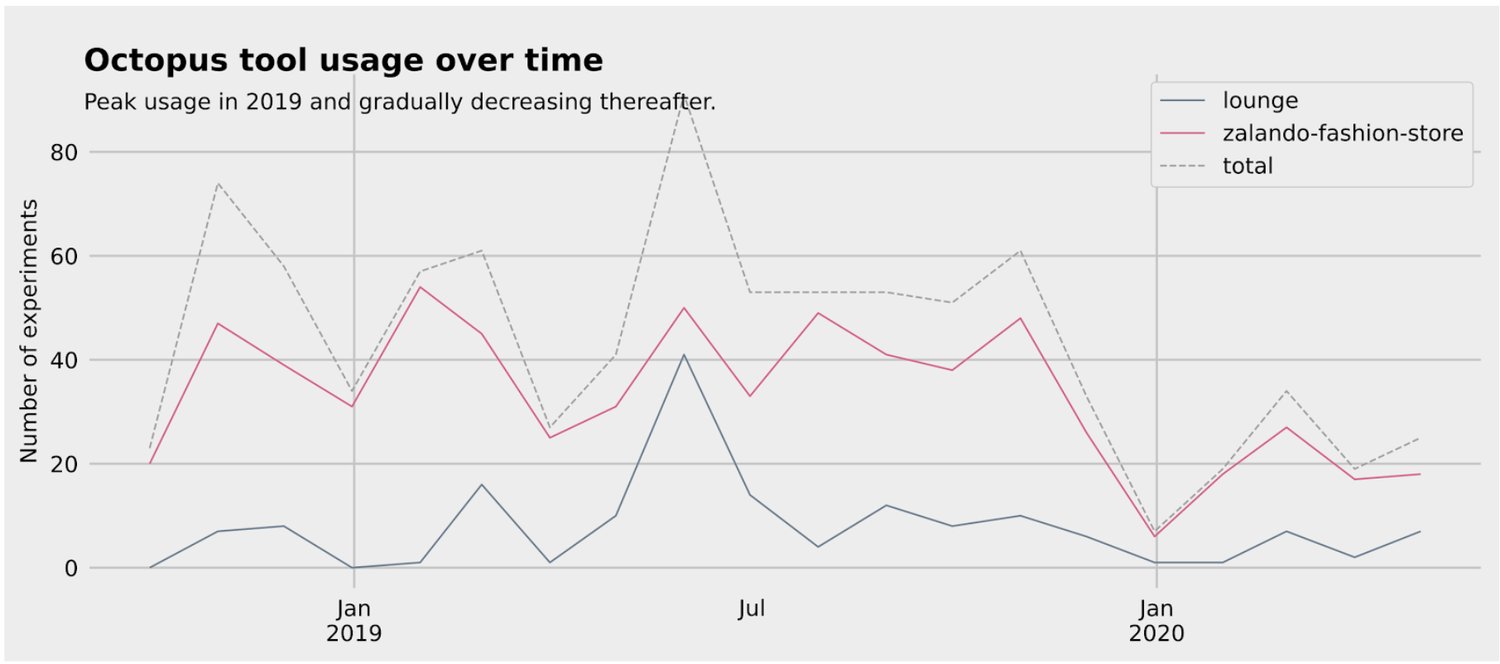
There is a decrease of number of A/B tests in early 2020. This decrease could have been due to a focus of teams on large-scale coordinated product initiatives, which were not A/B testable during this period. Another possible cause is that we suggest to pause A/B tests due to abnormal user behaviour in the beginning of COVID-19 in Europe.
On the other hand, we also faced a few big challenges. The keywords of improvements in this period are scalability and trustworthiness:
- Establishing experimentation culture. Many teams started to make product decisions through A/B testing, however, it’s a big company and the experimentation culture didn’t reach every corner. We started to look at use cases from various departments and integrated them into Octopus. We also provided in-person A/B testing training in the company at regular intervals. In addition, there is a company-wide initiative to ensure each team has embedded A/B test owners (product analysts or data scientists) who have sufficient knowledge of experimentation.
- Source data tracking. The experimental data were collected from each product team through tracking events (we track only users who provided appropriate consent). A dedicated tracking team ingested these events, unified data schema, and stored them in a big data database. However, data tracking concepts were not holistically understood across the company -- some teams define their own version of tracking event schema. This inconsistency resulted in corrupted and missing data. As a consumer of this data, our A/B test analyses suffer from data quality. This situation started to improve after a period of extensive cross-team communication and reorganization.
- A/B test design quality. Since we found that A/B tests from different teams had various level of quality, we introduced an A/B test design audit process as well as weekly consultation hours. Aspects of quality include testable hypothesis, clear problem statement, clear outcome KPI, A/B test runtime, and finishing based on planned stopping criteria. We also wrote internal blogs regularly to share our tips for effective A/B testing in Octopus.
- A/B test analysis method quality. To make our services trustworthy, we revisited our analysis methods rigorously in peer reviews with applied scientists from other teams. We documented analysis steps transparently. Through scientific peer reviews, we have identified potential improvement areas such as non-inferiority tests.
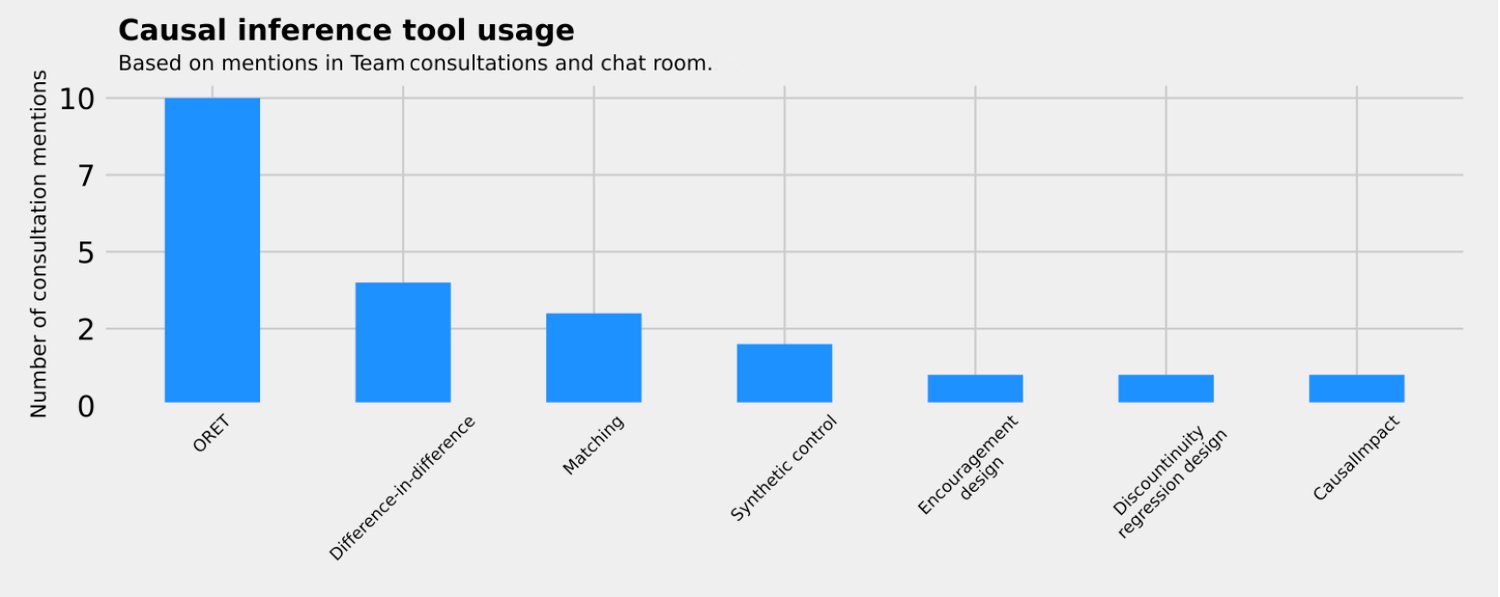
- The right analysis tool. A/B tests are not always feasible for every use case. For example, comparing performance between two countries. In such cases, quasi-experimental methods are better suited. We provided guidelines and software packages to help analysts to choose the right causal inference tool.
- Randomization engine latency. Some applications have strict requirements for latency. For example, a slightly higher loading times of product detail pages may cause customers to churn. We enhanced the latency of our services through a few engineering optimizations. Technical details will be discussed in later posts.
- Controlled rollout. In some cases, teams want to gradually increase the traffic into the tests, so that they don’t accidentally show a buggy variant to a lot of users. In other cases, several teams are working on a complex feature release and want to release the product at the same time. In general, such staged rollouts are called controlled rollouts. To support these use cases, Octopus created new features such as traffic ramp-up in experimentation and feature toggles.
- Analysis system scalability. The biggest challenge we had in this period is that our initial analysis system can not handle the load of concurrent A/B tests anymore due to constraints in its architecture. As the maintenance cost of the analysis system became too high, we didn't have capacity to work on improvement of analysis methods. We concluded that the need of a new analysis system was pressing. In the end, we spent two years rebuilding the new analysis system in Spark. Our lessons learned will be shared in a separate post.
Phase three: run (2020-)
At this point, experimentation culture is established in most parts of the company. With the scalable infrastructure ready, the team can now work on more advanced statistical methods.
We are looking forward to bringing experimentation at Zalando to a new stage by:
- Scaling out experimentation expertise. We have designed a new company-wide training curriculum that has a more smooth study experience. It covers causality, statistical inference, and analysis tools at Zalando. We have also increased the scope of causal inference research peer reviews to the whole company.
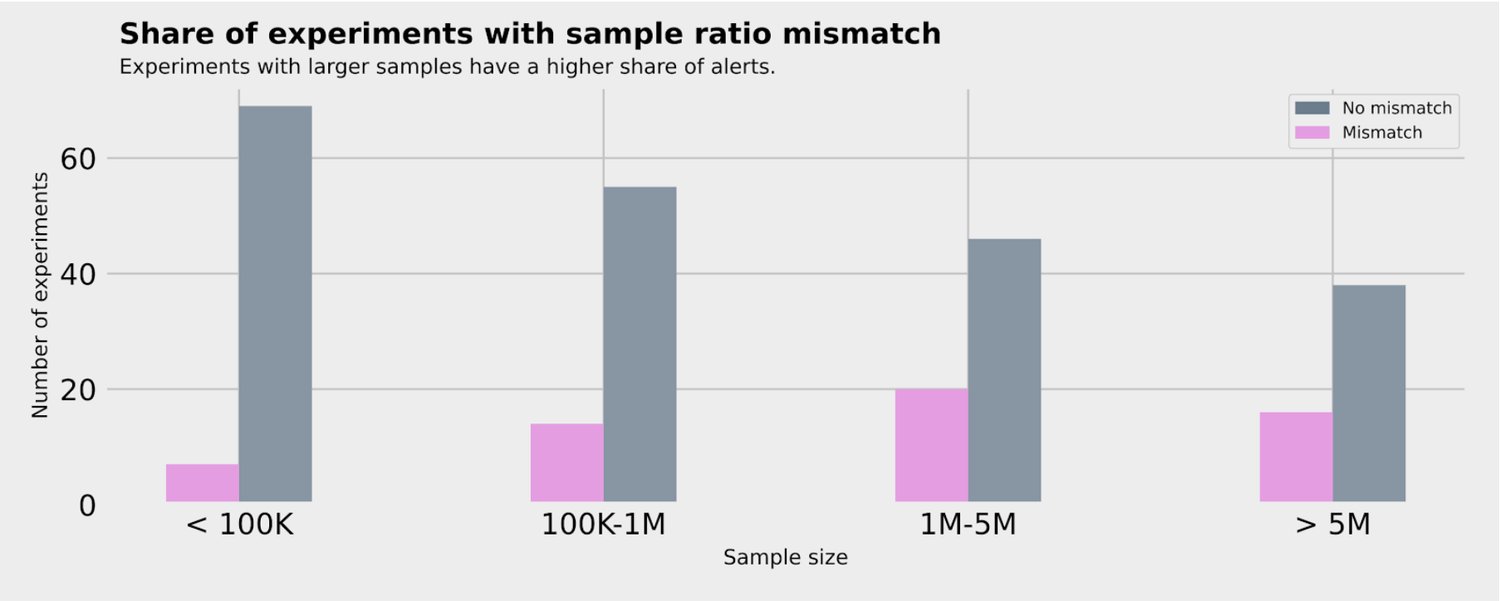
- Automating data quality indicators. A/B testing results are highly senstive to data quality. The most important data quality indicator is sample ratio mismatch -- the actual sample size split is significantly different from the expected sample size split. Companies similar to Zalando have identified that between 6-10% of their A/B tests have sample ratio mismatch, a similar analysis on our historical data shows that at least 20% of A/B tests are affected within Zalando. Our platform automatically raises alerts to the affected team when sample ratio mismatch is detected. Further data investigation will be needed before analysis results are shown to users in the platform's dashboard. Another major data quality issue is the data tracking consent imposed by GDPR. As we process data only for visitors who provided their consent, we have been working on research to understand the selection bias for A/B tests and its solution.
- Overall evaluation criteria. In the last few years, we understand from our users that selecting outcome KPI for A/B tests is a big pain point. We have now provided teams qualitative guidelines: a) KPIs should be team-specific. KPIs should be sensitive to the product that each team controls, i.e. each team can drive their KPIs by changing product features; b) KPIs should be proxies to long-term customer lifetime values, instead of short-term revenues. We plan to incorporate these guidelines into Octopus with scientifically proven methods.
- Faster experimentation. We found that the median runtime of an A/B test at Zalando is about three weeks. This is higher than similar companies in the tech industry. Many users might claim their test has time constraints based on business requirements. We plan to support trustworthy analysis for faster experimentation by more advanced analysis methods, such as variance reduction, Bayesian analysis, and multi-armed bandit.
- Stable unit assumption. In practice, each unit in the A/B test may not represent a unique person. For example, currently we are not able to detect the same person from Zalando website and Zalando App and assign him/her the same variant. A solution of this problem creates new engineering challenges due to latency requirement.
- Data visualization. Smart data visualization provides answers to questions you didn’t know you had. With complex and hierarchical data from A/B tests, there is quite some potential for data visualization designs.
Summary
To sum up, experimentation platform at Zalando has evolved a lot since 2015. Nevertheless, we are and will always be focusing on bringing more scalable and more trustworthy experimentation to Zalando. We thank all team members, contributors and leadership who made it happen during this incredible journey.
Future posts
In the upcoming posts, we will provide more details about the technical challenges and solutions of the experimentation engine, analysis system, data quality issues, and data visualization. Stay tuned!
We're hiring! Do you like working in an ever evolving organization such as Zalando? Consider joining our teams as a Data Engineer!


