Paper Announcement: A Practical Approach to Replenishment Optimization with Extended (R, s, Q) Policy and Probabilistic Models
Learn how the ZEOS replenishment optimization system achieves up to 22.1% GMV uplift by unifying probabilistic demand forecasting with risk-aware discrete event simulation.

Senior Applied Scientist

Senior Principal Applied Scientist

Applied Science Manager

Junior Machine Learning Engineer

Senior Machine Learning Engineer

Senior Applied Scientist
In the world of e-commerce, inventory management is a high-stakes balancing act often described as the Inventory Paradox. Carry too much stock, and your capital is locked in storage and liquidation; carry too little, and you face the "silent killer" of retail—stock-outs, where customer intent meets an empty shelf.
Following our previous discussion on the high-level architecture of our inventory optimization system, we are excited to dive into the applied science that powers the engine.
In our recent publication in Nature Scientific Reports, A practical approach to replenishment optimization with extended (R, s, Q) policy and probabilistic models, we describe how Zalando moved beyond traditional "point" forecasts to build a simulation-driven replenishment engine that explicitly optimizes under uncertainty.
The Design: A Unified Optimization Architecture
The ZEOS Inventory Optimization Tool isn't just a prediction model; it’s a central replenishment engine supported by a suite of probabilistic forecasting components. We combined Discrete Event Simulation (DES) with stochastic optimization to determine replenishment policies that maximize value across an article’s entire lifecycle.
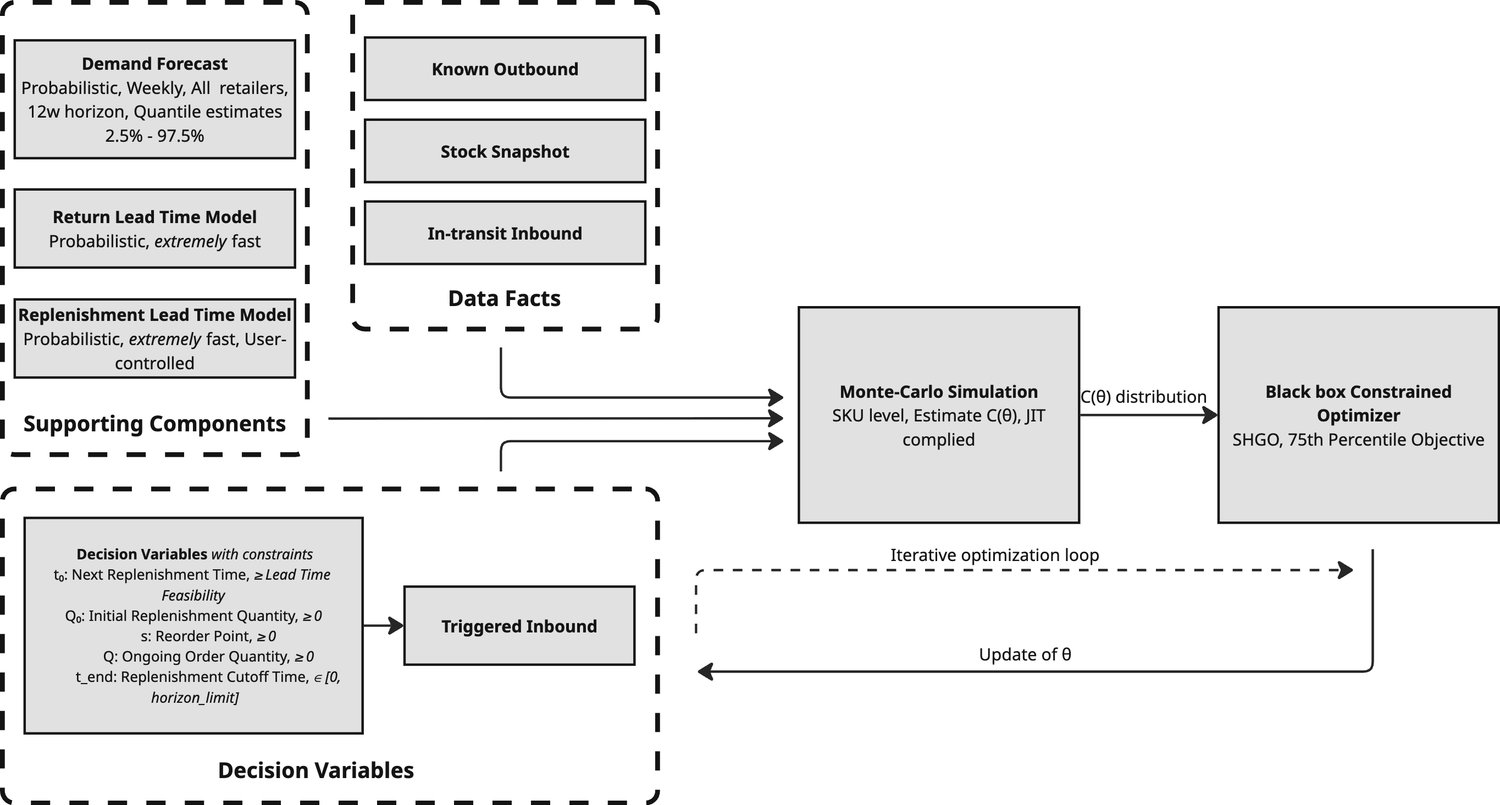
The system is built around three core pillars:
The Forecaster (LightGBM): The future is rarely a single number. Instead of predicting a single demand value, we model full probability distributions. By using quantile forecasts from our LightGBM-based demand service, the system accounts for tail risks—those rare but financially significant demand spikes that a simple average would miss.
The Engine (Extended (R, s, Q)): Classic reorder-point policies are often too rigid for the fast-paced world of fashion. We extended the classical \((R, s, Q)\) policy by introducing an initial kick-start quantity (\(Q_0\)) and a time-based lifecycle cutoff (\(t_{\text{limit}}\)). This allows the policy to be aggressive during a product's launch and conservative as it reaches its decay phase.
The Optimizer (Monte Carlo Simulation): We don't just optimize for the "best-case" scenario. We simulate thousands of plausible futures for each candidate policy. The optimizer then selects the policy that performs most robustly across that uncertainty.
Modeling Returns and Lead Times: While demand is our primary variable, we also model returns using empirically-derived lead time distributions from historical data, while replenishment lead times are sampled from Gamma distributions during simulation.
The Simulation Method: Discrete Event Modeling
How do we "test" a policy before it hits production? We run a Discrete Event Simulation (DES) over a 12-week horizon. Each Monte Carlo run represents one "alternate timeline" where demand, returns, and lead times evolve stochastically.

Within each simulated week, inventory follows a precise sequence:
- Intra-week processing: Expected inbounds and returns are added half before and half after demand fulfillment to approximate a continuous flow of goods.
- Demand realization: We sample weekly demand from the probabilistic forecast and fulfill it based on current on-hand inventory.
- Replenishment decisions: At review points, we check inventory against the reorder point (\(s\)). If it’s breached, a replenishment of size \(Q\) is triggered and enters transit with a sampled lead time.
- Cost accumulation: We track storage, inbound, outbound, return, and lost-sales costs across the entire 12-week horizon.
The Math: Optimization Objective
The optimizer’s goal is to find the specific policy parameters \(\theta = (t_0, Q_0, s, Q)\) that minimize the total cost over the simulated horizon:
To find the optimal balance, the engine weighs five distinct cost pillars:
- Storage (\(C_{\text{holding}}\)): Fees accumulated weekly based on physical stock levels.
- Logistics (\(C_{\text{inbound}}\) & \(C_{\text{outbound}}\)): Operational costs of moving goods to and from the fulfillment centers.
- Returns (\(C_{\text{returns}}\)): Specific processing fees for returned customer items.
- Opportunity (\(C_{\text{lost sales}}\)): The margin lost when demand is unmet, adjusted by return rates to reflect "realized" lost sales.
While the formula looks straightforward, two specific design choices make it powerful:
- Counterfactual Modeling: We handle the "unseen"—like demand that would have happened during a stock-out—using probabilistic distributions rather than rough guesses.
- Risk-Aware Optimization: Instead of minimizing the average cost, we minimize the 75th percentile of the cost distribution. This ensures our decisions protect against extreme, rare demand spikes.
Results: Computational Backtesting
To evaluate the efficacy of the extended \((R, s, Q)\) policy, we conducted an extensive computational backtest designed as a series of numerical experiments. This study spanned a full year (October 2023 – September 2024), utilizing ~2 million articles from approximately 800 merchants to capture a wide spectrum of demand profiles and seasonal dynamics.
By benchmarking the engine against professional human replenishment decisions, we observed a direct and stable translation of mathematical optimization into business value:
| Metric | Engine vs. Human Baseline Uplift |
|---|---|
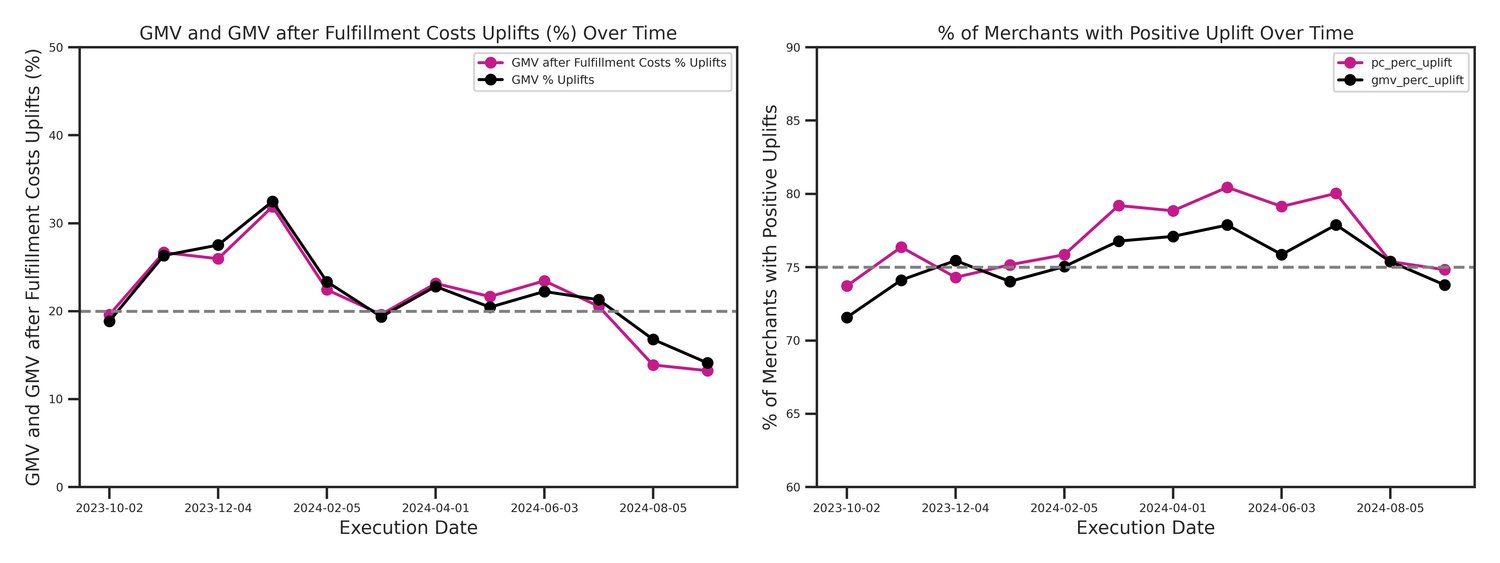
| Gross Merchandise Value (GMV) | +22.11% |
| Gross Margin (GMV after FC) | +21.95% |
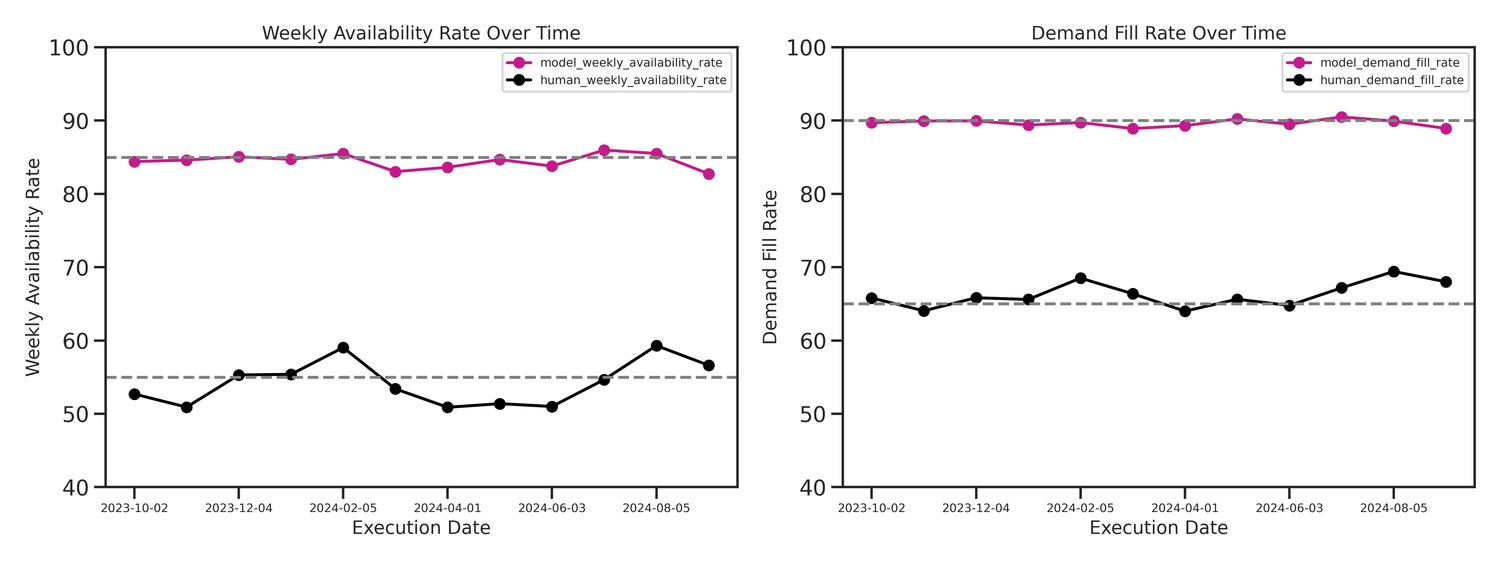
| Weighted Weekly Availability | +33.63% |
| Weighted Demand Fill Rate | +23.63% |
The computational experiments highlight several critical performance characteristics:
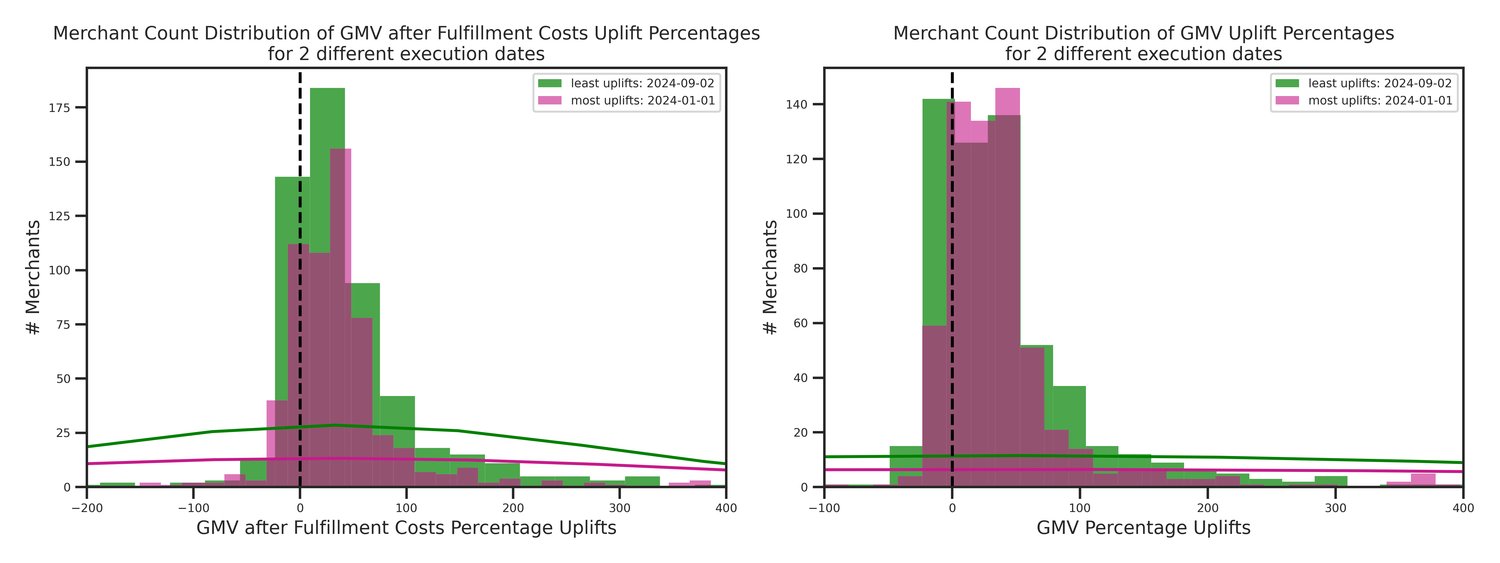
- Consistent Seasonal Performance: The positive uplifts in GMV and GMV after fulfillment costs remained remarkably stable throughout the 12-month period, demonstrating the engine's ability to navigate high-variance seasonal peaks and troughs without performance degradation.
- Stable High Service Levels: Financial gains were not achieved through aggressive overstocking. Instead, the engine maintained a consistent weighted demand fill rate of 91.14% and an availability rate of 86.40%, significantly outperforming human benchmarks across the entire temporal horizon.
- Broad Generalization: The numerical experiments confirmed that the benefits are not restricted to specific article types. Approximately 70–80% of merchants in the study saw positive financial uplifts, proving that the probabilistic approach effectively balances holding costs and lost sales across diverse merchant assortments.
Note on backtest implications: It is important to clarify that the uplifts cited above represent a theoretical scenario of 100% user adoption. Because the tool serves as an AI decision-support assistant, the final authority remains with the merchants. Actual results will vary depending on how consistently merchants choose to implement the system's suggestions.
Comparative Analysis & Ablation: Why it Works
While the backtest against human decisions quantifies end-to-end business impact, our baseline and ablation comparisons isolate exactly where the value is created.
Baseline Comparison: Algorithm vs. Tradition
We compared our Extended (R, s, Q) approach against standard industry policies under identical data and stochastic simulation settings.
| Policy | GMV Uplift | GMV after FC Uplift | Availability Rate Uplift vs Human | Demand Fill Rate Uplift vs Human |
|---|---|---|---|---|
| Extended (R, s, Q) (ours) | 22.11% | 21.95% | +33.63% (+21.75pp) | +23.63% (+17.42pp) |
| Tuned (s, S) | 13.39% | 14.80% | +18.65% (+12.23pp) | +14.35% (+10.71pp) |
| Periodic base-stock | 12.50% | 13.89% | +17.99% (+11.79pp) | +14.19% (+10.57pp) |
| Myopic Newsvendor | 5.07% | 5.60% | +11.61% (+7.60pp) | +8.10% (+6.03pp) |
The results show a clear hierarchy. Traditional policies like the Myopic Newsvendor or Periodic base-stock underperform because they lack the foresight to handle lead-time and return uncertainty. Even the Tuned (s, S) policy, which is a common industry standard, falls short because its static thresholds cannot match the responsiveness of our extended (R, s, Q) variables (\(Q_0\) and \(t_{limit}\)) in a high-variance environment.
Ablation Study: The "Secret Sauce"
Is the success driven by the better forecast or the better optimization? We stripped the model down to find out.
| Configuration | GMV Uplift | GMV after FC Uplift | Availability Rate | Demand Fill Rate |
|---|---|---|---|---|
| Probabilistic Forecast + Percentile Objective (ours) | 22.11% | 21.95% | 86.40% | 91.14% |
| Probabilistic Forecast + Mean Objective | 19.02% | 20.16% | 81.27% | 87.98% |
| Point Forecast + Percentile Objective | 6.37% | 5.98% | 77.76% | 84.95% |
The takeaway is definitive: You need both. Switching from point forecasts to probabilistic ones provides the single largest gain. However, optimizing for the 75th percentile rather than the average provides that final, critical layer of stability, particularly in protecting the merchant against high-impact "tail" events.
Conclusion
This work proves that meaningful improvements come from explicitly embracing uncertainty. By combining probabilistic forecasting and discrete event simulation, we’ve bridged the gap between inventory theory and the massive operational scale of Zalando. Our optimization engine can deliver substantial value across key metrics:
- Up to 22% increase in Gross Merchandise Value (GMV) and Gross Margin compared to human replenishment decisions
- 34% improvement in availability rate and 24% improvement in demand fill rate
- Stable performance throughout seasonal peaks and troughs over a 12-month period
- Positive financial uplift for 70-80% of merchants across diverse inventory profiles
These results demonstrate that inventory optimization isn't just a theoretical exercise—it's a practical solution that drives real financial growth while improving customer experience through better product availability.
For the full methodology and mathematical formulation, read our paper on Nature Scientific Reports.
Presbitero, A., et al. (2025). A practical approach to replenishment optimization with extended (R, s, Q) policy and probabilistic models. Nature Scientific Reports. ↩
We're hiring! Do you like working in an ever evolving organization such as Zalando? Consider joining our teams as a Machine Learning Engineer!