From Homegrown to Flink: Migrating a Stateful Ad Event Join at Scale
We replaced a homegrown in-memory stream join with Apache Flink, halved our infrastructure cost, and eliminated in-memory state loss on restarts.

Senior Software Engineer
Background
We are the Ad Platform team at Zalando Marketing Services (ZMS). We build the data pipelines that power Sponsored Products, the paid placements that advertisers use to promote their items across Zalando's catalog and product card pages.
When a customer sees or clicks a sponsored item, that interaction needs to be matched against the original auction that placed it. The auction record carries the ad server's delivery decision context; the interaction event carries the result. Joining the two is what turns a raw click into a billable charge and closes the feedback loop to our ad serving system.
This join has to happen in near-real time and within a bounded window. We limit it to 15 minutes: interactions that arrive after that are dropped. Missing an event means an advertiser action goes unbilled, so the match rate is a business-critical metric.
This article focuses on the near-real-time stream that supports ad server logic. Correct billing and campaign reporting also rely on a separate batch data pipeline. Together they form a near-classical lambda architecture, but that is a topic for another post.
The homegrown solution was developed more than 7 years ago at an ad-tech startup later acquired by Zalando. It was simple and worked, but accumulated limitations that improvements alone couldn't fix.
Homegrown solution
It was a distributed Java application, which consumed Kinesis and Nakadi (abstraction on top of Kafka) streams, storing bid events in a basic in-memory cache. On each user interaction event, it searched for the corresponding bid event by key in the cache and tried to match, enrich, and produce a billing event. Since we had quite a heavy load, up to 200MB/s, we used multiple pods for this application.
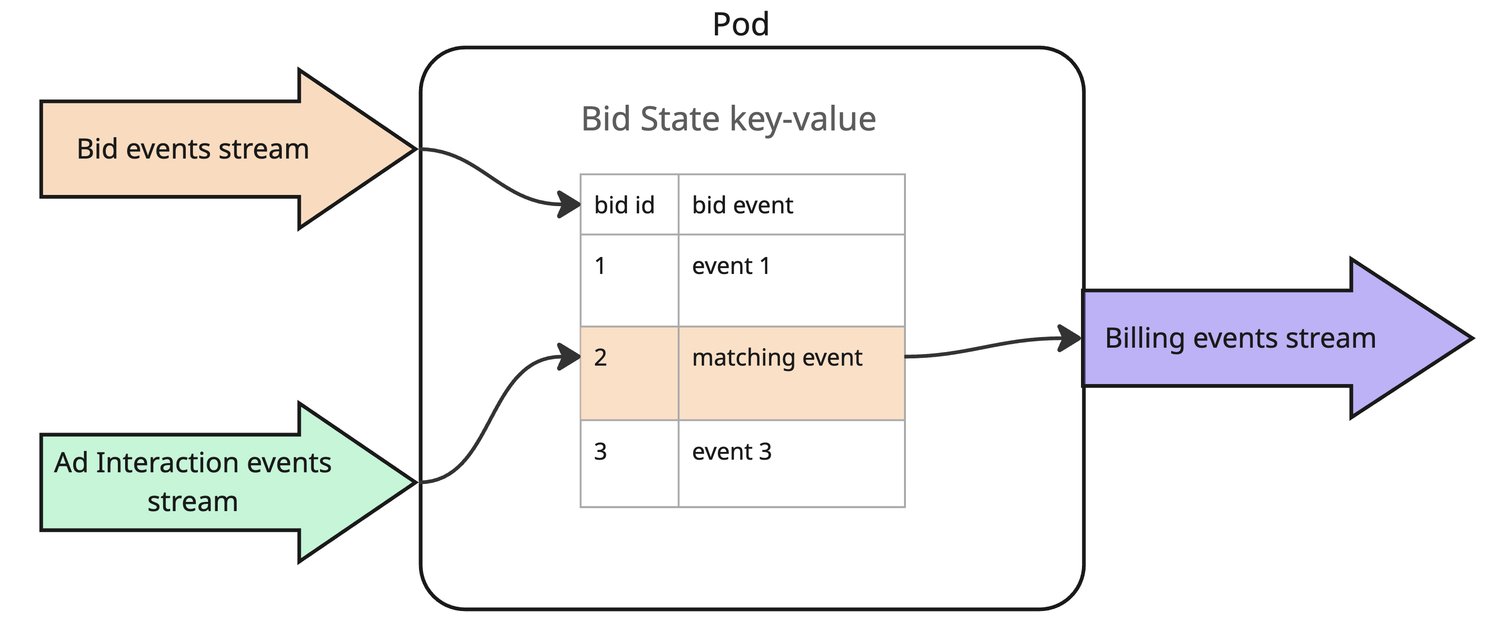
Because it was very straightforward, it worked fine, but with some caveats that should have been addressed:
- Pods couldn't be cleanly partitioned across both streams, so each pod had to read all interaction events in addition to its share of bid events.
- It didn't have any memory state backup or checkpointing, losing stored events on each deploy or rescale operation.
Those issues led to overprovisioning of pods, to avoid re-scaling operations.
Alternatives
Option 1. Keeping the old application: We could improve it by implementing checkpointing and aligned stream partitioning, but better tools already existed.
Option 2. Nakadi SQL: Zalando's internal stream processing framework. A PoC showed only ~50% event match rate, which was not viable. The pipeline dropped a significant portion of events without a clear explanation, and we didn't invest further in diagnosing it.
Option 3. Apache Spark: Has adoption at Zalando, but other teams who had evaluated both reported better latency and autoscaling behavior with Flink, and that was enough to rule Spark out.
Option 4. Flink: Already in production at Zalando across multiple teams. Fits our use case well: keyed state, event-time joins, checkpointing, horizontal partitioning. Downside: TRIAL status on our Tech Radar (Flink has been promoted to ADOPT in the meantime) and limited team experience.
The Tech Radar TRIAL status and limited team experience were real risks, but the Zalando Flink guild and existing production deployments across other teams made the risk acceptable.
Architecture: What We Built
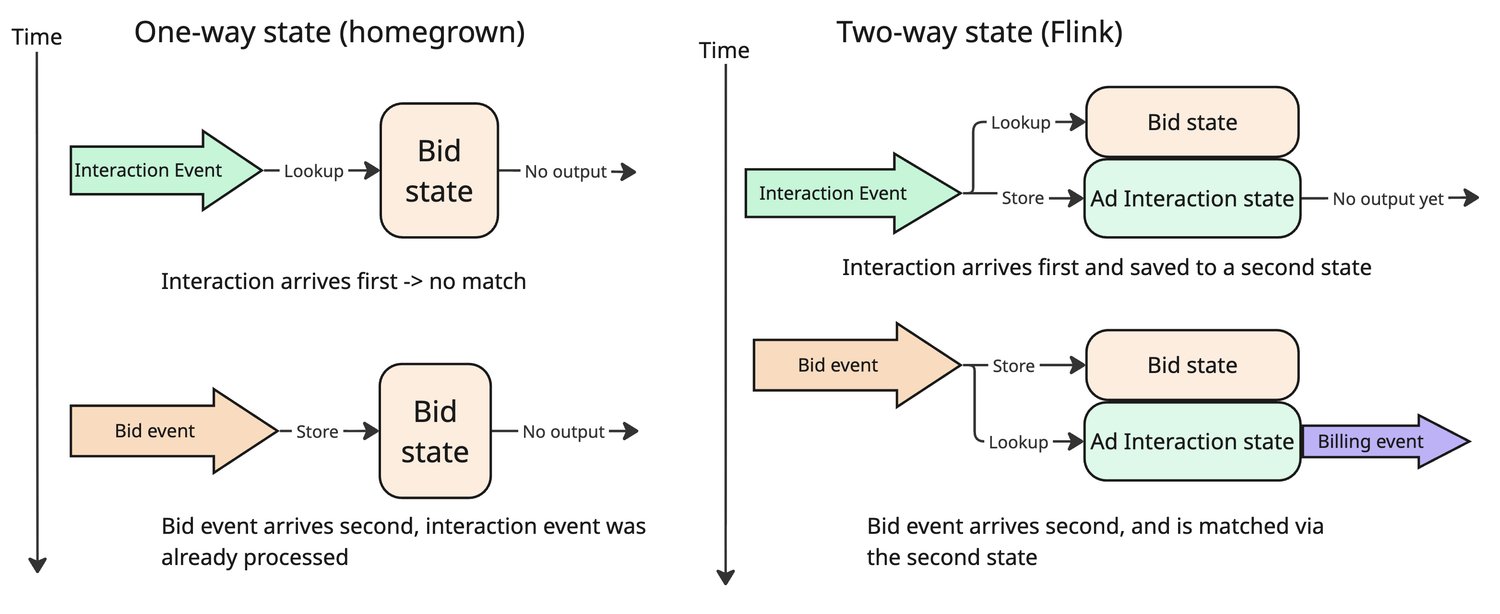
The join logic stayed the same: consume two streams, match events within a 15-minute window, produce billing events. We made two improvements over the homegrown solution.
We added a RocksDB state backend with incremental 3-minute checkpoints. On any restart or rescale, the pipeline recovers from the last checkpoint instead of losing up to 15 minutes of buffered events. This is what made safe autoscaling possible.
We also buffer state for both streams instead of just bid events. The homegrown solution dropped any interaction event that arrived before its corresponding bid. Buffering both sides handles this out-of-order case and increased the event match rate by 0.5%.
The Road to Production: What Actually Happened
Infrastructure: AWS managed vs K8s
We chose the AWS managed deployment option for faster prototyping and quickly discovered it was simple but not flexible or transparent.
Managed solution offered:
- Limited autoscaling tuning (CPU only)
- Metrics via CloudWatch only
- Limited integration with the Zalando ecosystem
- Support for Flink v1 only
K8s solution offered:
- Lower cost
- Full control over cluster configuration, environment, and autoscaler
- Good Zalando infrastructure integration
- Flink v2 support
Later we migrated to K8s deployment, using Zalando application templates.
API Choice
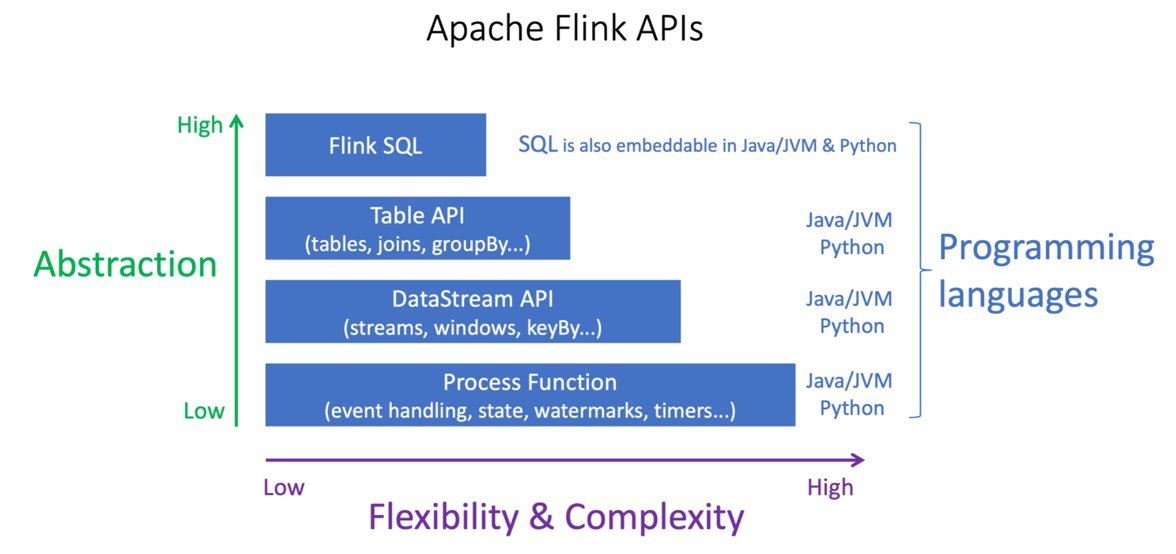
There are 4 levels of abstractions in Flink API. We chose Datastream API since we had deep Java knowledge and could solve potential issues, and we needed configuration flexibility.
Join choice
There are two categories: high-level join operators (window join and interval join) and low-level processor functions.
Available high-level join types:
- Window Join
- Tumbling Window Join
- Sliding Window Join
- Session Window Join
- Interval Join
For our scenario, applicable high-level options are Sliding and Interval join, where Sliding is overkill by definition, because we don't need the sliding feature.
Interval join
First approach
Initially we thought interval join would be a good fit for our use case: It supports keyed partitioning and the same time boundaries we needed:
orangeElem.ts + lowerBound <= greenElem.ts <= orangeElem.ts + upperBound
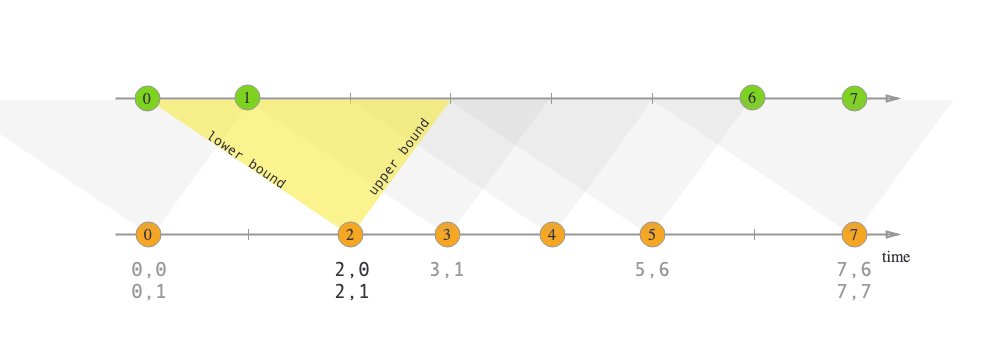
The system worked but used quite a lot of workers and resources, more than our status quo application.
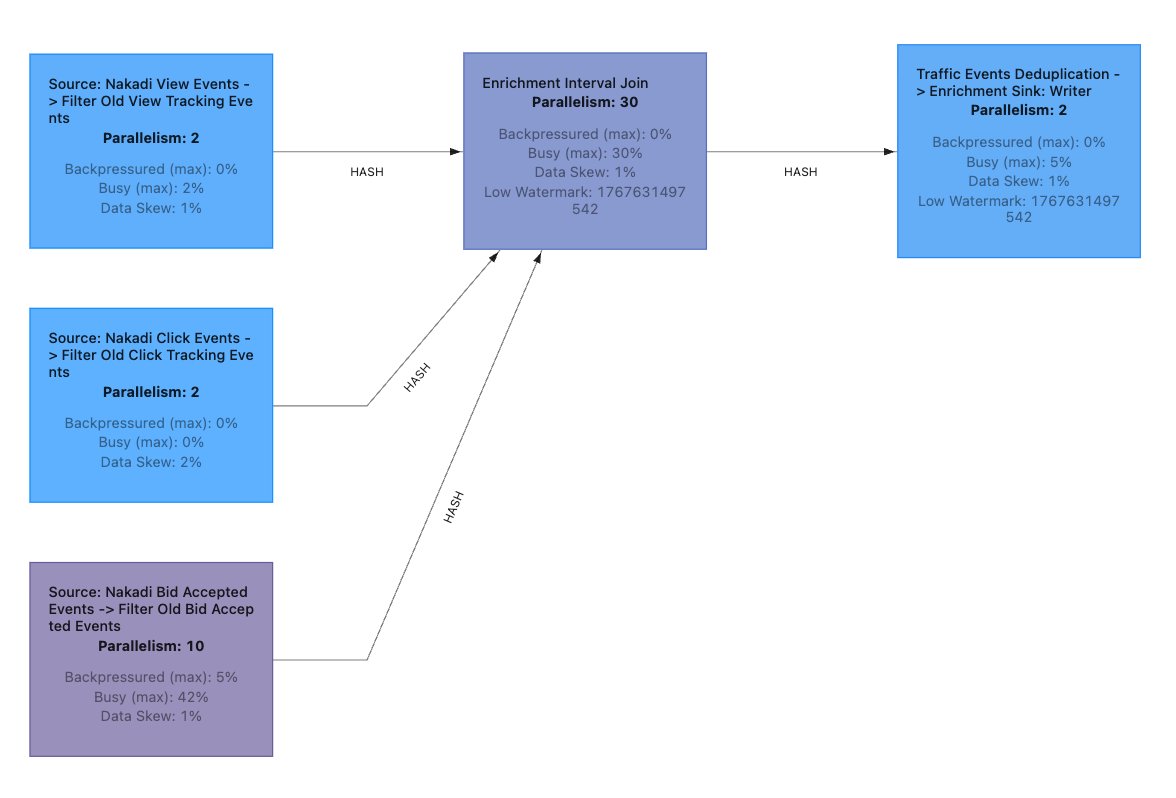
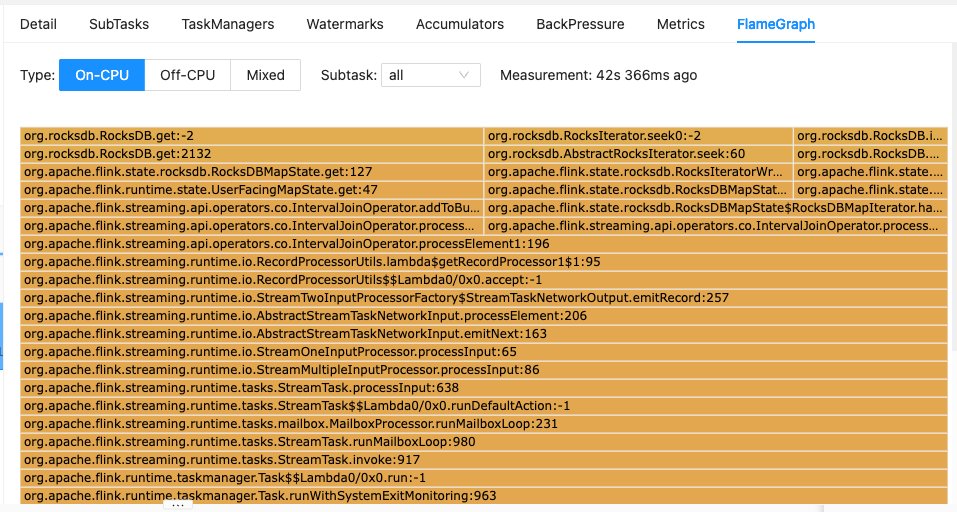
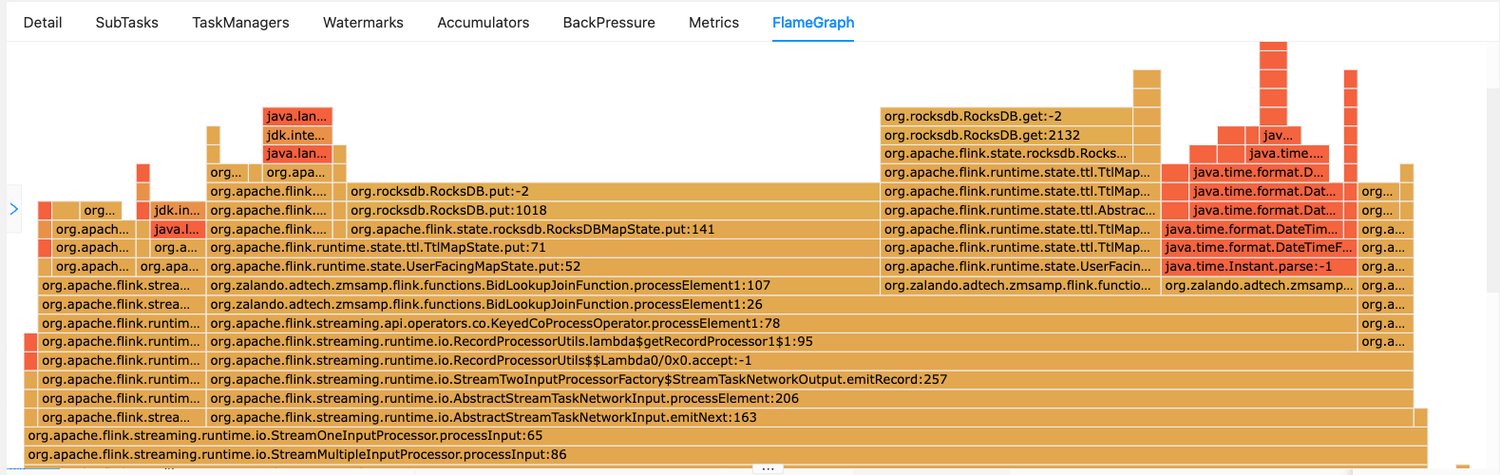
Flame graph and seeks
The critical finding was in the Flame Graph in the Flink UI. Interval join used about 15-30% of CPU just on seek operations.
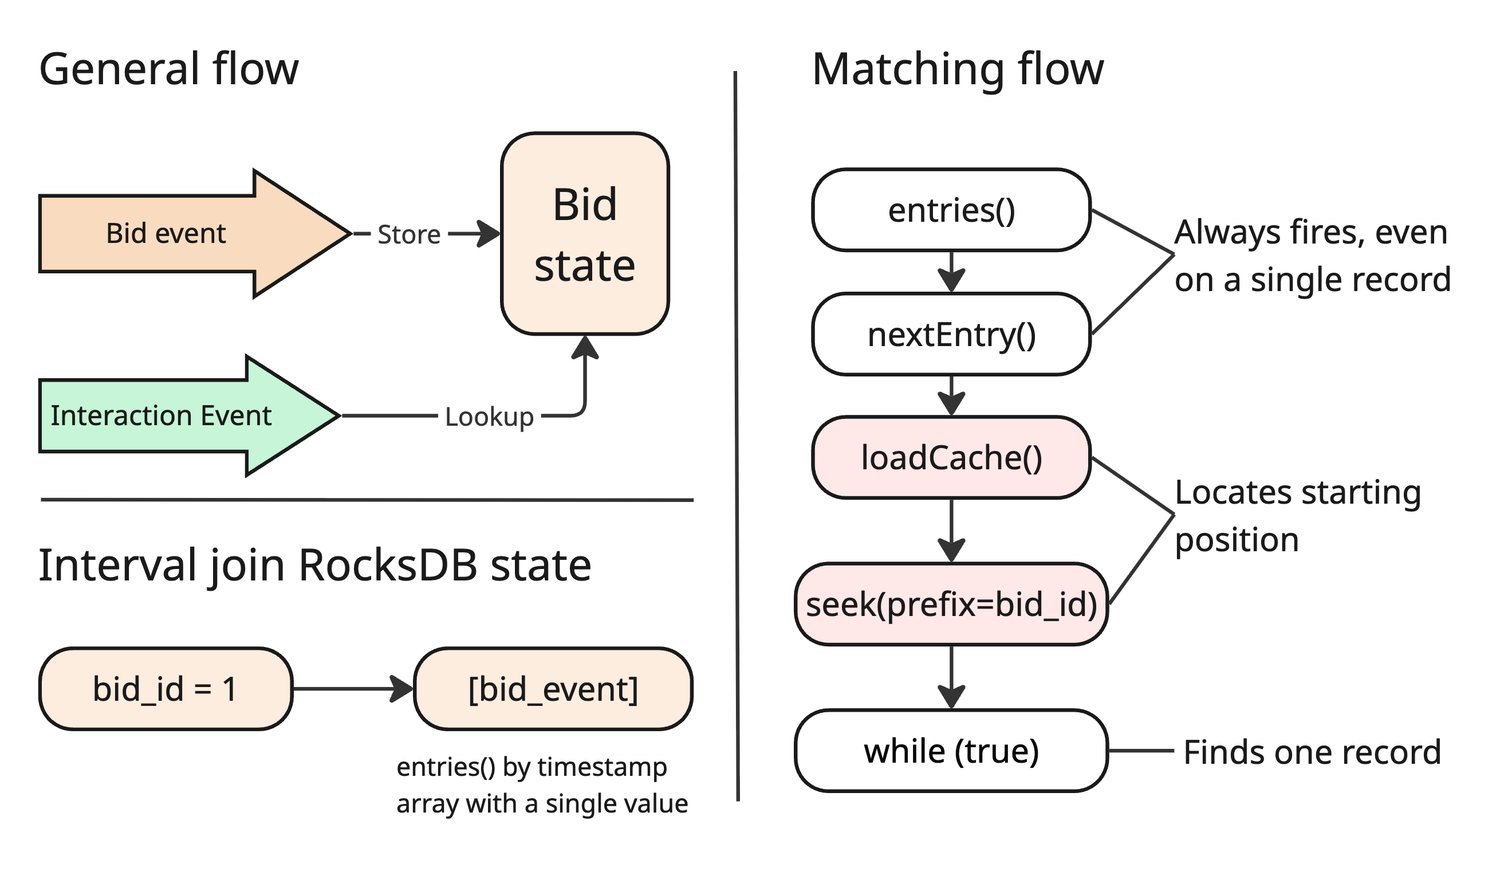
Looking at the interval join implementation, the matching path opens a RocksDB iterator and performs a seek before reading any records, regardless of how many entries the partition contains. Since our bid IDs are unique, each partition holds exactly one entry, but the seek fires on every element processed. A seek requires locating the starting position across sorted files on disk, making one seek per element a significant overhead at our throughput.
Interval join also uses expiration timers stored in a RocksDB-backed sorted set with an in-memory cache. With a 15-minute window at our throughput, this queue grows to ~70 million entries permanently. When the cache is drained, Flink seeks into RocksDB to reload the next batch, generating a second source of constant scans.
So even though there are options to optimize this algorithm, e.g. via increased cache block sizes and using in-memory state, the approach is algorithmically not suitable for our scenario.
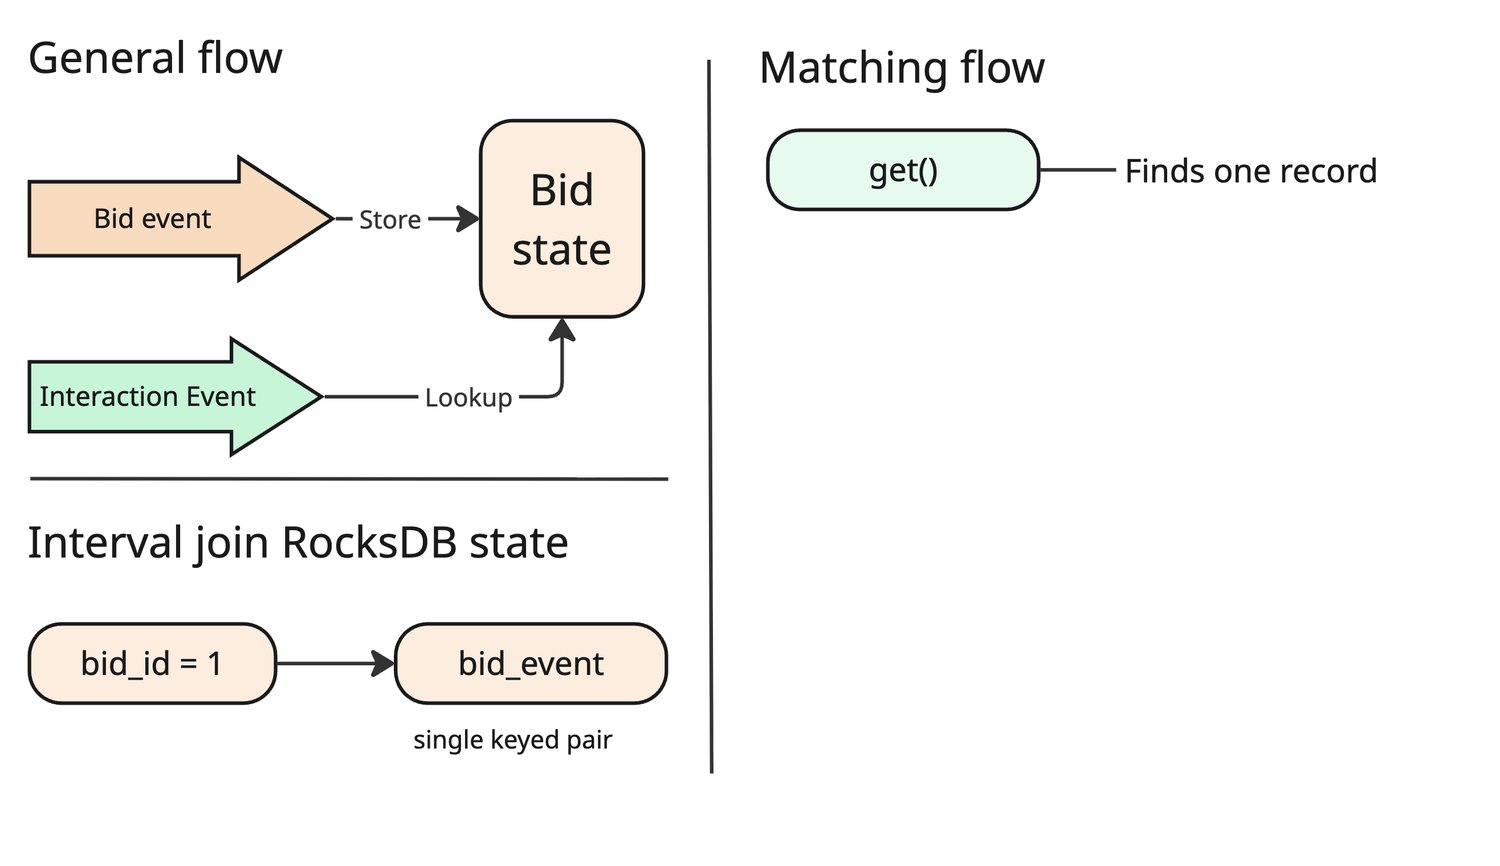
Why KeyedCoProcessFunction solves it
To solve this, we wrote our own matching logic using KeyedCoProcessFunction. We created two ValueStates, one for bid events and one for interaction events, both partitioned by bid ID. Since bid IDs are unique, each lookup is a direct point lookup in RocksDB with no iterator and no seek.
State expiry is handled by RocksDB's TTL compaction in background instead of explicit timers, so there is no per-element timer registration and no ~70 million entry queue to maintain. Watermark advancement no longer needs to scan a timer queue at all, eliminating the second source of seeks.
Flame graph:
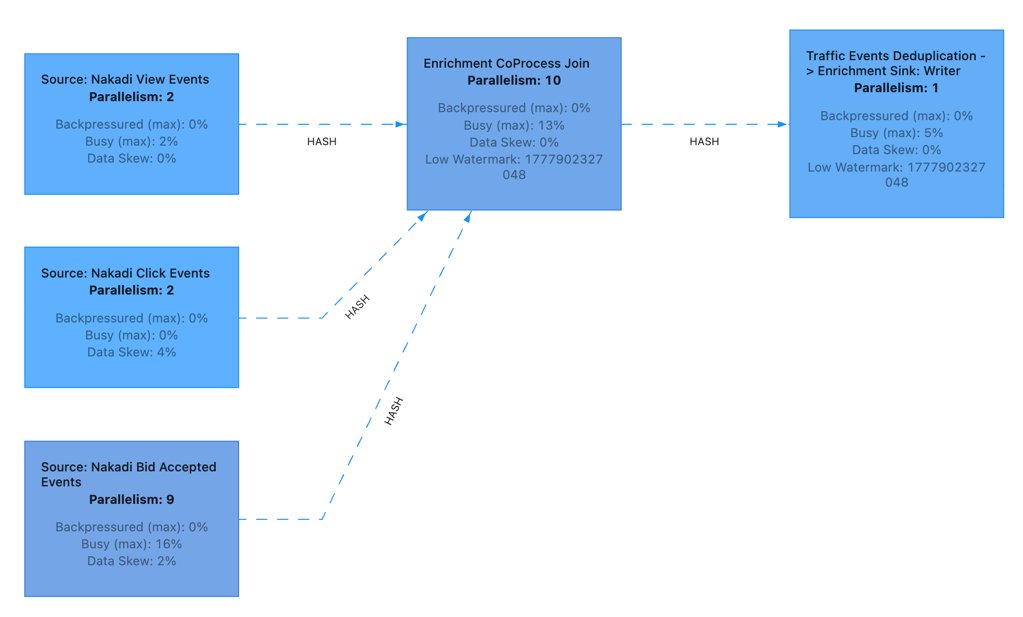
Resource usage improvement
| Subtasks | Load | Memory | CPU cores | |
|---|---|---|---|---|
| Before | 30–60 | 30% | 150–300GB | 30–60 |
| After | 10 (max) | 15% | 50GB | 10 |
These numbers are for the join operator only (5GB memory and 1 CPU core per subtask). The full application includes three source operators, a deduplication step, and a sink, which accounts for the higher overall resource usage.
The low-level approach gave us full control over the matching and expiration algorithms, which was the key to this efficiency gain.
RocksDB full state increase
After migration from the Interval join to low-level Process join we had problems with growing state and cleaning up the cache. Since there were no timers, we needed other options for cleanup. We also used incremental checkpoints with a state backend, and the only available out-of-the-box cleanup option is during state compaction. Otherwise, we would need to manually create timers.
Growing state size:
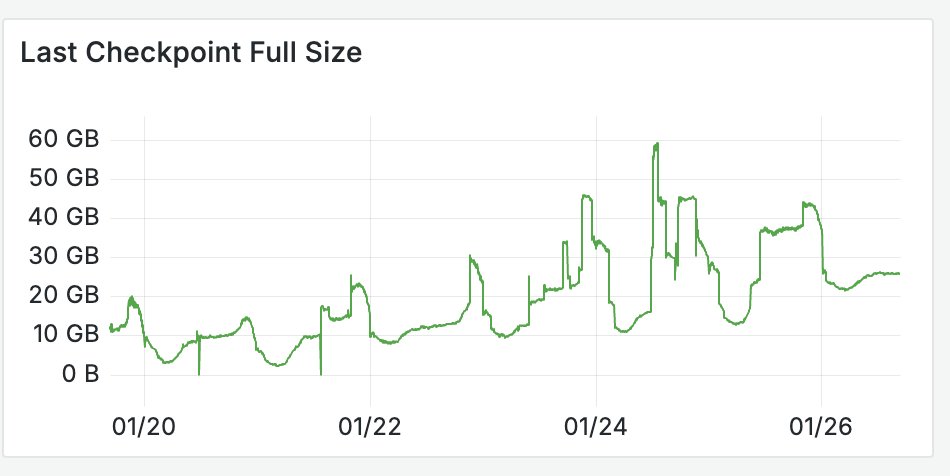
Default settings didn't work for us so we needed to tune a lot of RocksDB settings.
We increased write buffer and compaction file sizes so compaction runs less frequently but processes more data per run, giving the TTL filter more opportunity to collect expired keys:
state.backend.rocksdb.writebuffer.count: "16"                           # default: 2
state.backend.rocksdb.writebuffer.size: "512MB"                         # default: 64MB
state.backend.rocksdb.compaction.level.target-file-size-base: "256MB"   # default: 64MB
state.backend.rocksdb.compaction.level.max-size-level-base: "1GB"       # default: 256MB
After a rescale, RocksDB files still contain keys that no longer belong to the subtask. These flags trigger an async compaction and range delete to reclaim that space promptly:
state.backend.rocksdb.incremental-restore-async-compact-after-rescale: "true"
state.backend.rocksdb.rescaling.use-delete-files-in-range: "true"
We also enabled SSD-optimized settings and LZ4 compression to reduce the on-disk footprint:
state.backend.rocksdb.compression.per.level: "LZ4_COMPRESSION"    # default: SNAPPY_COMPRESSION
state.backend.rocksdb.predefined-options: "FLASH_SSD_OPTIMIZED"   # default: DEFAULT
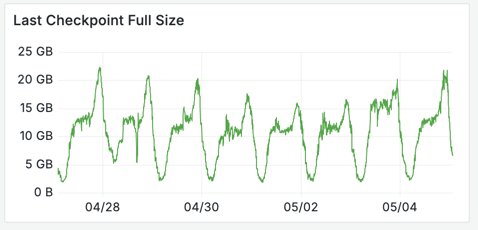
And state stabilized after that:
Infrastructure: Kinesis streaming
Connector
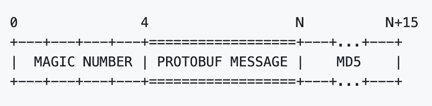
The Kinesis Flink connector library surprisingly had no support for reading aggregated events using Protobuf. We had to write our own deaggregation layer inside Flink to be able to read such events. Fortunately, AWS Docs had a good description on the format.
Multiple Consumers
We also wanted to experiment with Flink in production, so we built a shadow application, reading the same source streams. Initially we just used Kinesis as-is, upscaled to accommodate two consumers. Kinesis documentation says that this is fine. As it turned out, it was insufficient. Until we enabled Enhanced Fan-Out, we had occasional ReadProvisionedThroughputExceeded errors. We had up to 3 consumers: status quo app, Firehose archiver, and Flink. Even though there were enough shards, the KCL v3 load-balancing algorithm in the Java application wasn't distributing the load properly.
Since Kinesis is also an Amazon tool, the Kinesis connector was only available for Flink v1.
Eventually, because of those issues, we decided to migrate the ad server's delivery decision context stream to Nakadi, similarly to the user interactions stream. By that time, Flink-Nakadi connector was ready to use with Flink v2.
Connection limits
Nakadi connections are limited per application. Since each subtask configured via parallelism option has its own connection, the limit can be reached easily. This is likely applicable to Kinesis as well, since it has a read quota per shard.
Pod evictions
K8s configuration allows more flexibility but that also entails pitfalls. Configuration should be properly set. Karpenter (the K8s node autoscaler) evicted our pods during rescaling operations before they were ready to consume from streams. Flink has its own autoscaler and K8s shouldn't interfere with it. This led to many issues with autoscaling before it was detected.
We were using an early Flink application template that didn't prevent the K8s autoscaler from removing pods during Flink's own rescale operations. Adding the appropriate annotation to block K8s from interfering resolved it. A PodDisruptionBudget is an alternative way to enforce the same protection.
OOM kills
Memory tuning wasn't straightforward either. We needed to find out the required CPU to Memory ratio, because the load type was different due to checkpoints. Flink used much more CPU than our status quo. That was done experimentally. We used 5GB of memory per CPU.
Also, Flink has many memory properties which can impact execution and checkpointing. At first, we used auto-tuning recommendations, which can be found in logs, but still we saw occasional OOM kills.
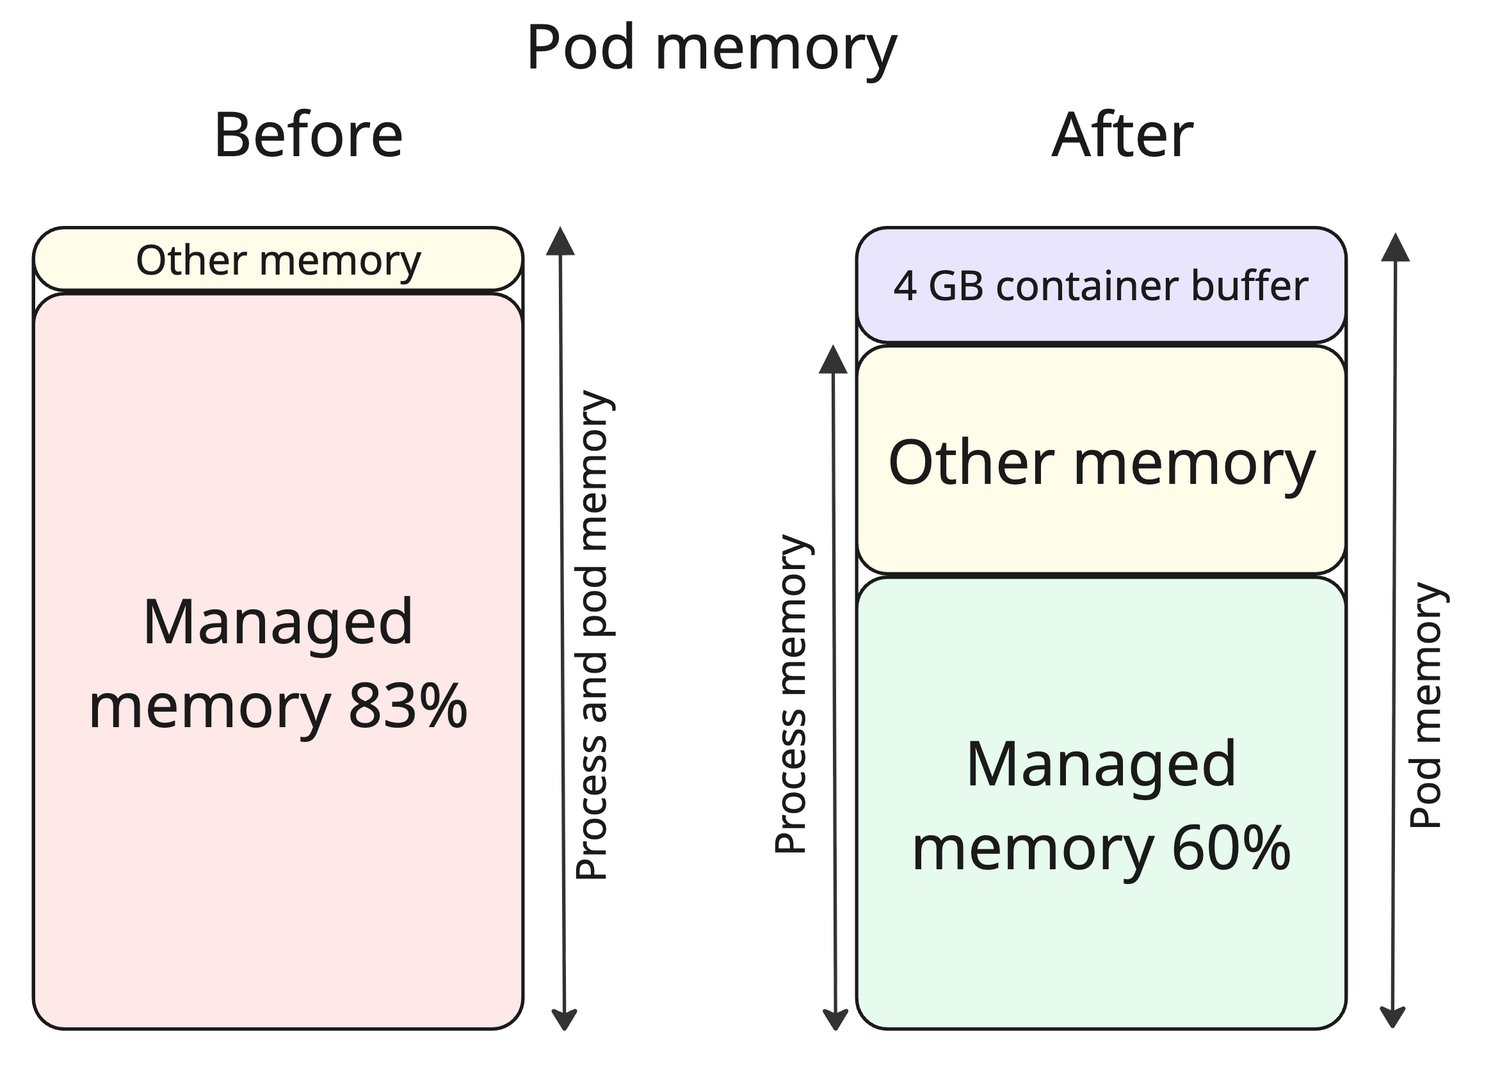
The OOM kills were not Java OutOfMemoryError exceptions. The Linux kernel was terminating the process. Since each Flink pod runs as a single JVM process, a kernel kill took down the entire pod with no graceful handling.
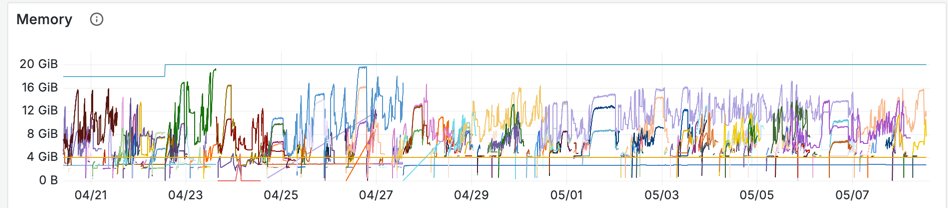
We increased pod memory from 16GB to 20GB, creating a 4GB buffer above the JVM process size. We set the overhead max param and decreased managed memory fraction. Both had been previously recommended by auto-tuning but were not correct. RocksDB also uses native memory, so it needs some buffer.
| Parameter | Before | After | Default |
|---|---|---|---|
taskmanager.memory.jvm-overhead.fraction | 0.063 | 0.2 | 0.1 |
taskmanager.memory.jvm-overhead.max | 1GB | 4GB | 1GB |
taskmanager.memory.managed.fraction | 0.83 | 0.6 | 0.4 |
taskmanager.memory.jvm-metaspace.size | 138MB | 256MB | 256MB |
And on the memory chart we see that the application maintains a buffer now:
Migration
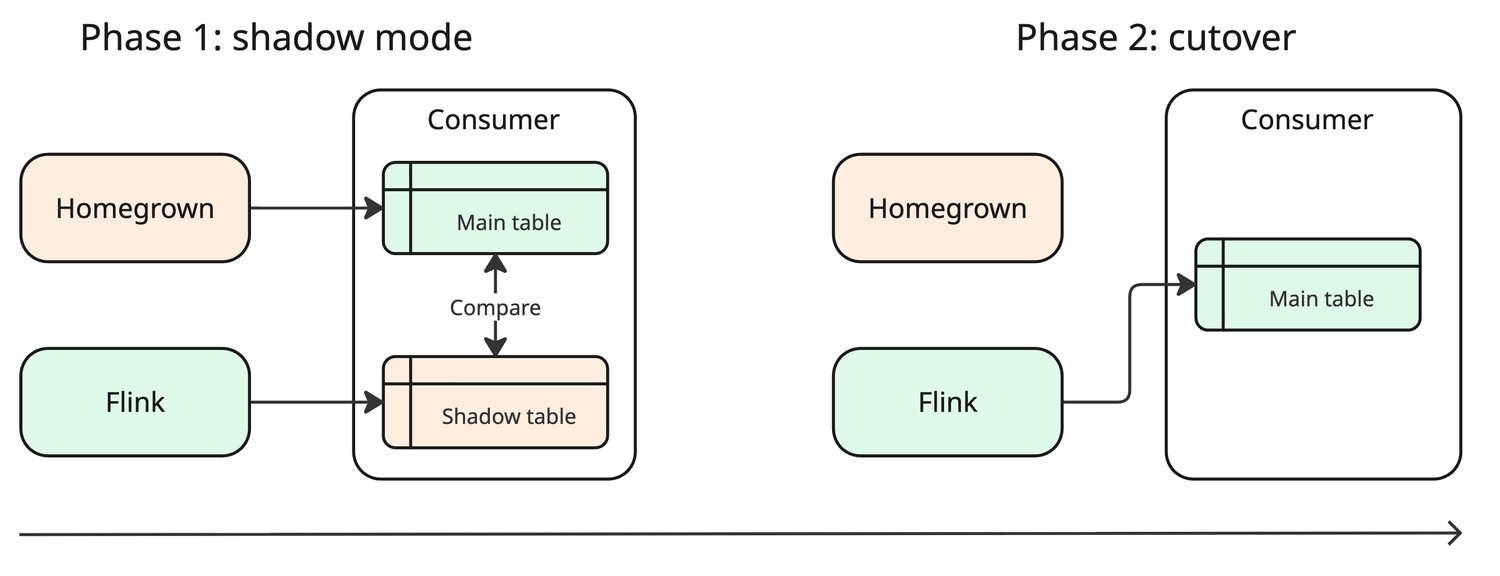
We built a full shadow pipeline for the migration, with dedicated input and output streams for convenient analysis. In the downstream service that consumes traffic events, we integrated a Nakadi client to also read the shadow stream and write to a shadow table in parallel with the main pipeline. This let us compare real production data without any customer impact.
We ran the shadow pipeline for four weeks. Validation compared:
- Event enrichment success rate: Flink output matched the status quo at 99.9% on average (our threshold was 99-101%)
- Output correctness: views, clicks, and clearing price associated with each ad and user interaction were aggregated per campaign per day and compared against the production table
- Processing latency: measured from auction initiation to Flink output, validated to stay within the 15-minute join window
- Duplicate rate: ~0.2% by event ID in the output stream
With shadow metrics stable, we ran a one-week A/B test to validate campaign outcomes end-to-end. No significant negative differences were detected. With the A/B test confirming equivalence, we switched the downstream service to consume from the Flink stream via a config update.
Results
The most important improvement was checkpointing. Previously, any restart or rescale lost up to 15 minutes of buffered events. With 3-minute incremental checkpoints, the pipeline recovers from the last checkpoint instead, making aggressive autoscaling safe without state loss and eliminating the need to overprovision pods.
This reduced average pod count from a constant 20 to 5 on average (range 1-8). The reduced pod count drove three improvements:
- CPU reduced from 30 to ~20 cores (Flink uses more CPU for state management than the homegrown solution did).
- Memory reduced from 320GB to ~100GB.
- EC2 costs reduced from ~€80 to ~€30 daily.
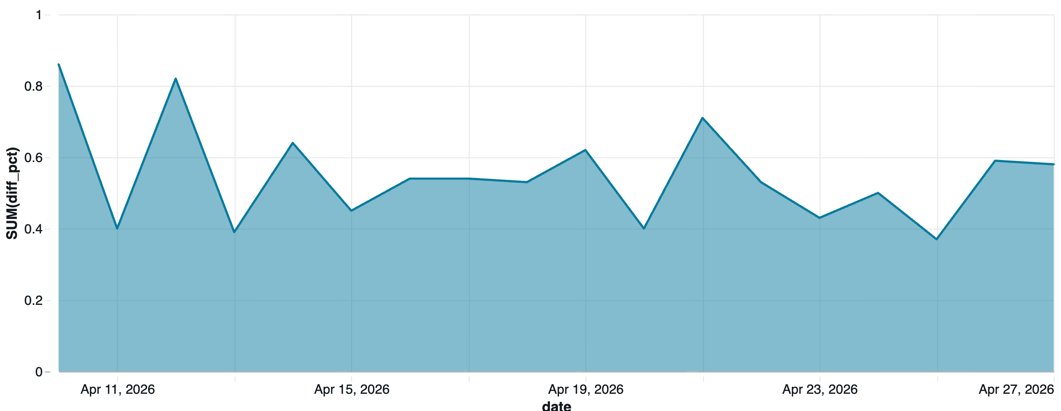
The two-way matching algorithm also increased event enrichment success rate by ~0.5%.
What's Next
This was just a first step. We plan to move event aggregation directly into Flink, eliminating a downstream service that currently does this after the fact. We also plan to migrate the Sponsored Brands equivalent of this pipeline, which has the same homegrown join architecture. Other parts of the ad feedback loop are candidates too. The Flink autoscaler configuration also has room for further tuning. Longer term, we aim to unify the Sponsored Products and Sponsored Brands enrichment pipelines into a single Flink application.
Credits
Kudos to all ZMS Ad Platform team members who participated in analysis and development. Thanks to the Zalando Flink guild who helped us resolve complex issues and gave advice.
We're hiring! Do you like working in an ever evolving organization such as Zalando? Consider joining our teams as a Software Engineer!


