Thundering herd of circuit breakers
A client-side circuit breaker stays open for hours, blocking 95% of traffic, and won't close. Our service shows no sign of being unhealthy. To understand the anomaly, we build a custom span visualizer on top of OpenTelemetry trace data and find a circuit breaker trap that our existing dashboards don't reveal.

Senior Software Engineer

Senior Software Engineer
The Case Opens
Our service has several clients. One of them has the shape of a pipeline operating on a schedule that produces very high load in the mornings and almost none otherwise. Another one produces a more organic traffic pattern, driven by customer traffic. Our service has a known problem of struggling to cope with the combined morning traffic. While this is not ideal, it is also not a big problem as the clients are robust enough to deal with it.
Let's focus on the client serving organic customer traffic (from now on the client) that's calling our service (from now on the service). During the morning period, it deals with some timeouts, potentially opening and closing a circuit breaker, and recovers without major issues.
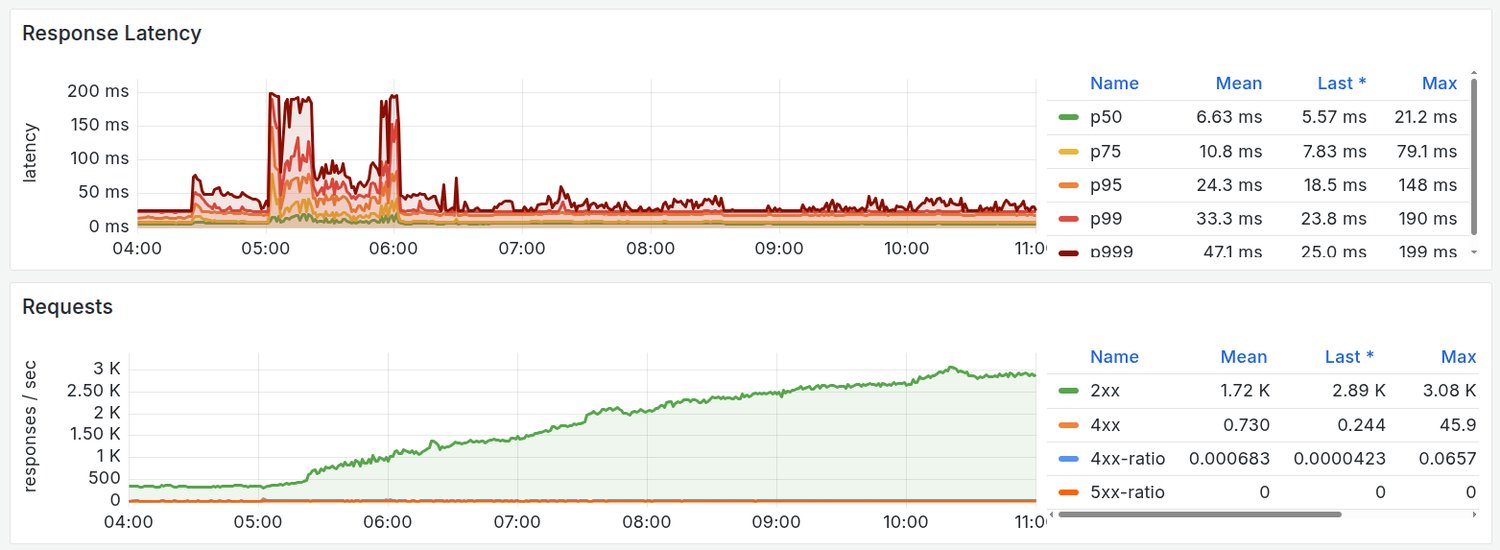
That's expected behavior. But then comes the morning of The Anomaly. The service recovers from the increased traffic and elevated latency, but this time it appears as if the client sporadically stops sending requests. The circuit breaker in the client stays open for hours, blocking roughly 95% of requests.
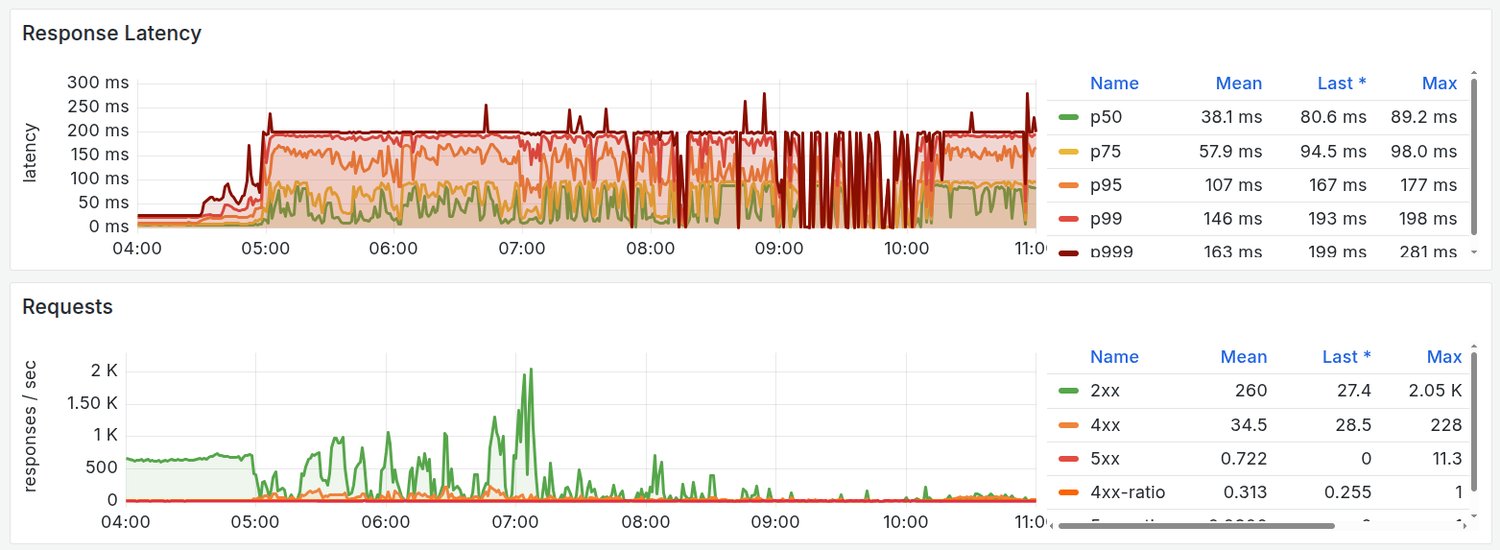
The request rate is quite low (~5 RPS / pod). The dashboards available to us do not reveal the recovery cycle, and low traffic makes aggregate percentiles difficult to interpret.
Some requests seem to be fast, but others are evidently slow enough to keep the circuit breaker open, despite the service handling barely any traffic. That makes no sense. At low request rates the service should have plenty of headroom. There is no visible reason the requests shouldn't be fast.
We force-close the circuit breaker, making the traffic flood back in. Pods rapidly scale out to handle the load, there is a brief error spike during that scale-out, and then everything stabilizes.
Fast forward a few weeks and the same thing happens again. This time, before force-closing the circuit breaker, we pre-scale the service first to avoid the error spike. When we go to close the circuit breaker, we notice something unexpected: it is already closed.
Two approaches, both working, but for reasons that aren't obvious. The service looks healthy in both cases with no errors and no restarts. Why can't the circuit breaker close on its own in the first place? And why does scaling the service out help it close?
Following the Evidence
The natural starting point is the service itself. Maybe there is something wrong that standard metrics aren't capturing: a slow query, a connection pool issue, something that makes the service behave differently under low traffic. We dig through dashboards without finding a convincing answer.

What the dashboards can't show is how individual requests are handled at scale. Aggregate percentiles and request-rate graphs smooth over the details of what is happening. Standard trace tooling gives you one trace at a time, in a waterfall view. Useful for debugging individual requests, but not the right format for understanding what's happening across hundreds of concurrent requests over a 10-minute window. AI agents are usually limited to the same tooling, either looking at individual traces or coarse metrics, so they only accelerate the hopeless grasping at straws and burn tokens as a bonus!
The data is right there, but at the same time it feels so far away. We need to look at more traces in detail, simultaneously, in a way that lets us see the circuit breaker behavior. The tooling is just not there for this case though, so at this point we give up and blame cold caches or Kubernetes or the phase of the moon. Just kidding! We export raw OpenTelemetry trace data as CSV and build a purpose-made trace visualizer.
A New Magnifying Glass
The trace visualizer is a bespoke vibe-coded single-page HTML webapp that loads Dash0 CSV exports and uses uPlot to visualize a large number of traces all at once.
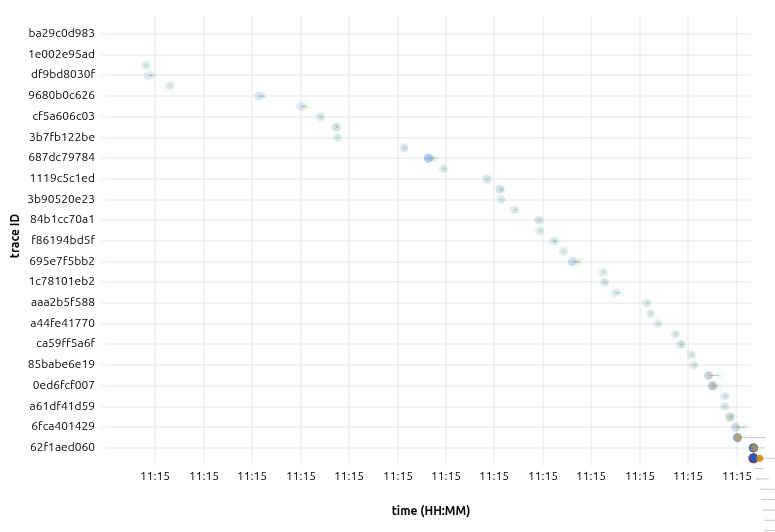
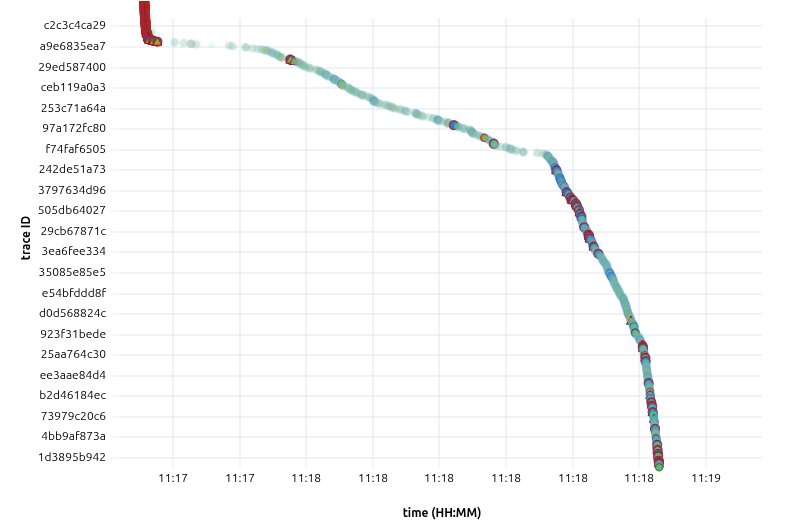
We present spans in an XY plot with time on the X axis and sequential traces on the Y axis, ordered by the first client span. Since both axes represent time in their own way, the spans always flow from the top left to the bottom right. Due to the nature of the plot, the steeper the slope, the more traces (requests) there are in a specific time period. Client spans that time out are marked in red, while the opacity of each span represents its duration.
We load traces from the 10-minute window around the circuit breaker finally closing for good, and the failure mode appears immediately: the circuit breaker failing to close properly.
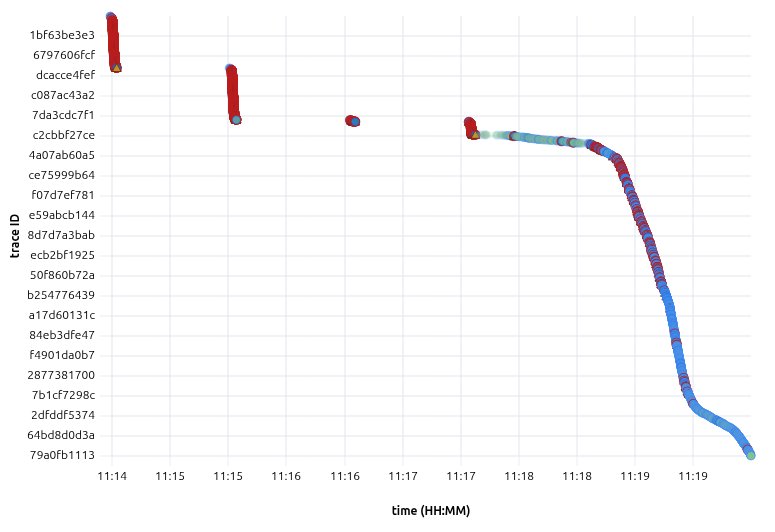
Zooming into one of the failed attempts shows the full cycle: sparse probes, then the avalanche of timed-out requests when the circuit breaker closes.
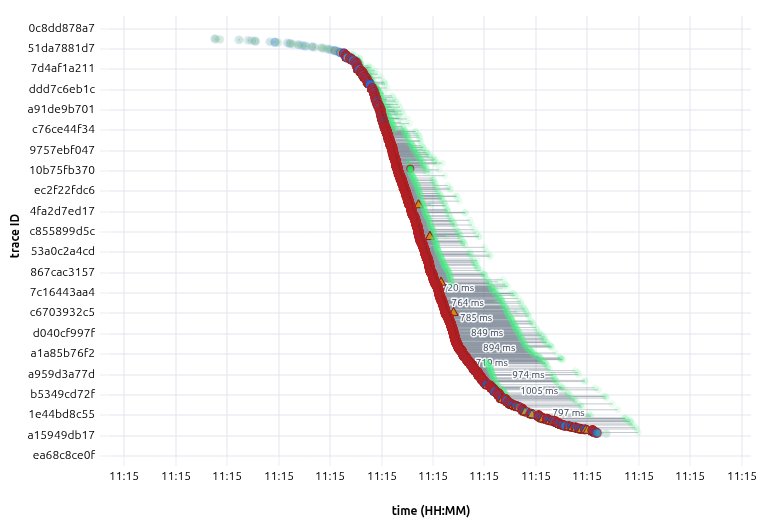
Zooming into one of the bursts shows what the half-open probing phase of the circuit breaker looks like from the inside.
The probes meet the circuit breaker's success criteria.
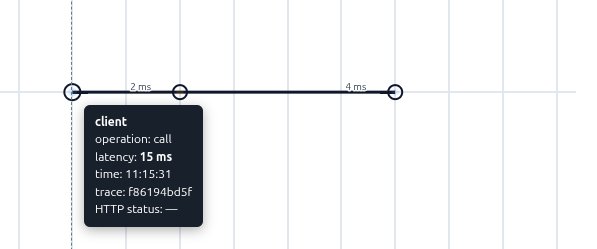
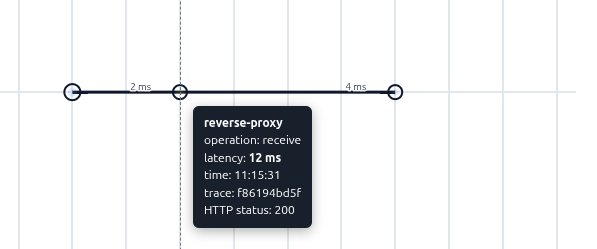
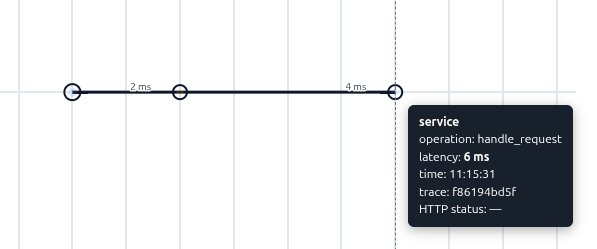
Then the circuit breaker closes, triggering a stark increase in requests.
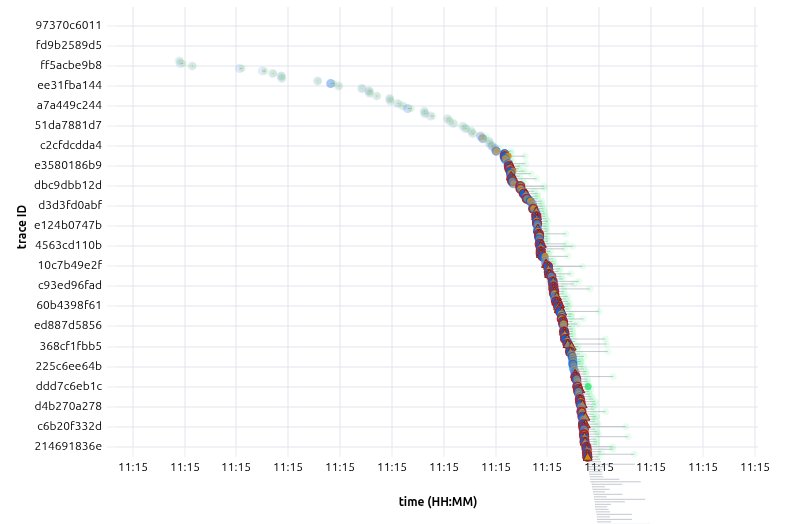
All the traffic withheld while the circuit breaker was open arrives at once. The service goes from receiving a handful of probes to being trampled by the thundering herd of heavy traffic released by the closed circuit breaker. Zooming in on the first seconds of the avalanche, we can observe the queuing behavior trace by trace.
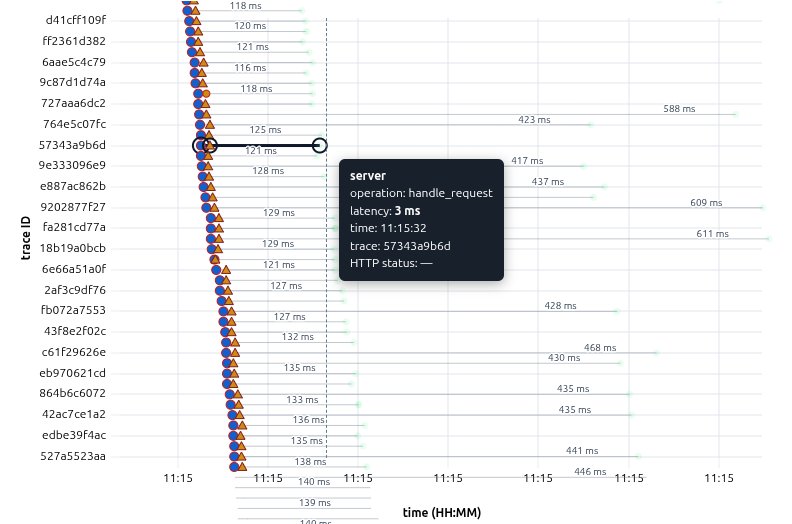
With barely 5 requests per second coming in, the Horizontal Pod Autoscaler (HPA) has scaled the service to a minimum of only three pods. As each pod now tries to cope with 10x the traffic, the incoming requests start queuing much faster than the pods can process them.
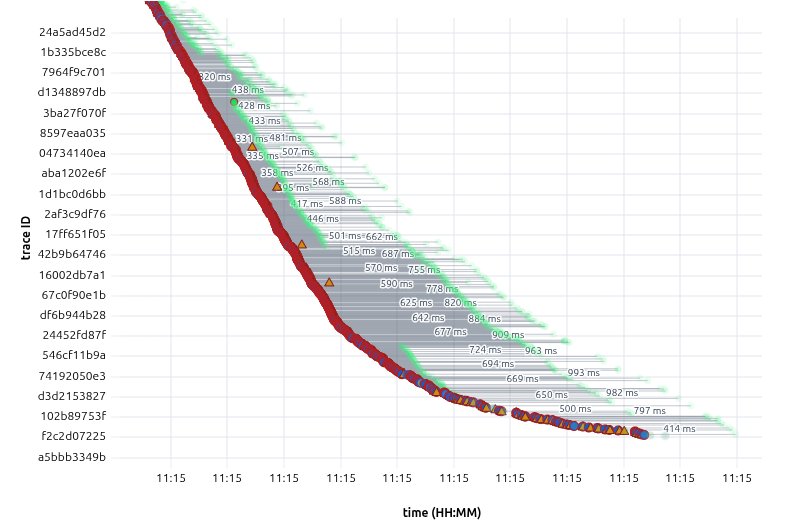
Nearly all requests time out. The circuit breaker opens back up. The entire sequence of probes succeeding, the circuit breaker closing, avalanche, and re-opening is visible as a single dense burst in the trace view. It lasts about three seconds. If you average the CPU over the course of a minute, this might register as just a small blip. The CPU-based autoscaler does not detect sustained overload, so the service stays at three pods and the cycle repeats.
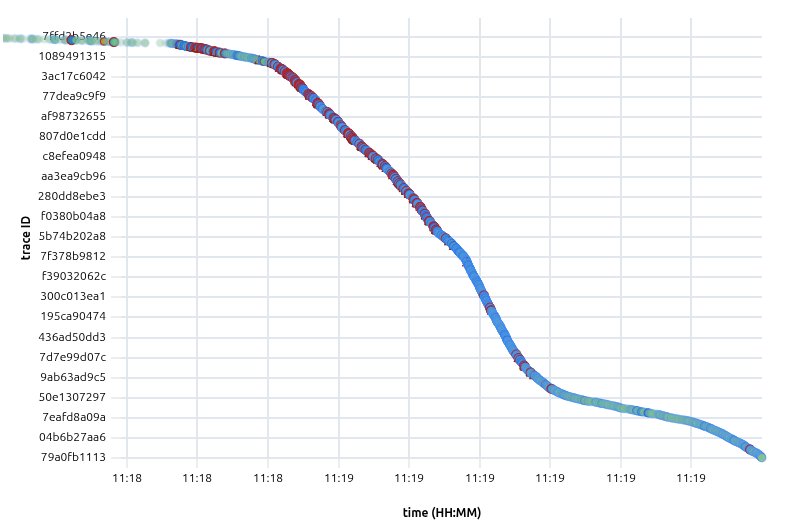
Zooming back out to the full view, we now focus on what happens once the service is manually scaled out (see the right side of the trace view).
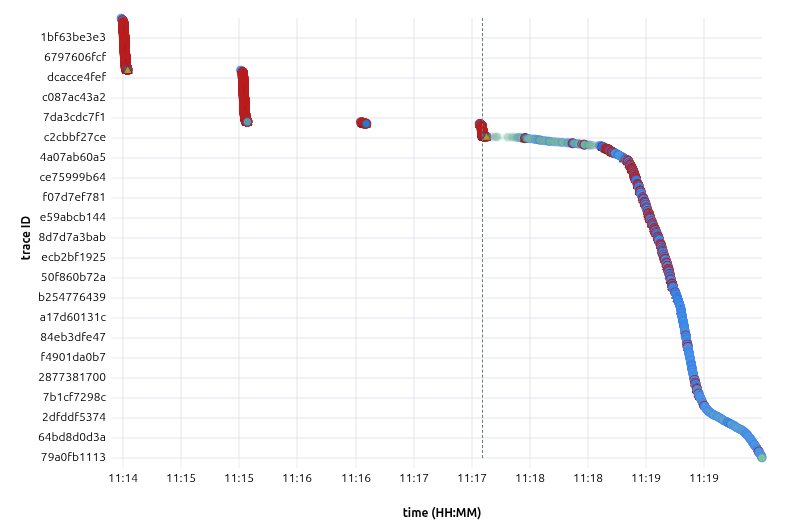
The same probing phase appears, the circuit breaker closes, and we observe the avalanche. But with many more pods waiting, the service is able to absorb the load. Some initial timeouts remain (red) and latency is slightly higher (darker blue) as cold caches warm, but it quickly transitions to a stable state as the system settles (light blue).
How the Trap Was Set
The interaction between the circuit breaker and the service is now obvious.
The circuit breaker enters the half-open state and only allows a trickle of probe traffic. Because the open circuit breaker has reduced traffic, the HPA has scaled the service down to its minimum replica count. The probes arrive on a cold, under-provisioned service but there are so few of them that the service handles them fine with fast responses. The circuit breaker's success threshold is met and it closes.
But the service the circuit breaker measures is not the same as the service under a full load. The moment the circuit breaker closes, the client starts sending its full request load to the service. The service, still at its minimum replica count, can't absorb the burst. Queues fill up, latencies spike, requests time out, the circuit breaker opens back up, and we fall into the trap again.
This also explains why both mitigations work:
Force-closing the circuit breaker restores real traffic volume. The HPA sees sustained load and scales the service out. Once enough pods are running and warm, the service handles its actual load and the circuit breaker stays closed.
Pre-scaling before the natural close means the service is already sized for full traffic when the circuit breaker closes on its next probe cycle. The avalanche arrives, but there's capacity to absorb it, so the circuit breaker doesn't re-open.
Closing the Case
The failure we observe looks like a variant of what Google's SRE book calls the low-traffic services problem: at low request volumes, individual request variance dominates and metrics stop being representative of the system under high load.
The investigation surfaces a few lessons:
- Circuit breaker probes can't detect auto-scaling capacity. The circuit breaker validates the service as it is while probing, not as it will be when the circuit breaker closes and full traffic arrives.
- HPA can't react to three-second bursts. Averaging CPU usage over a window of minutes does not capture short load bursts that only last seconds at a time.
- The service processes requests after they've been cancelled. When the client times out and drops a request, the service keeps working on it, making queue growth worse during the avalanche.
- Bespoke visualizers lead to useful insights. Looking at aggregated metrics or individual traces isn't always helpful. Agents that use the same tools as humans can only reduce toil, but using them for guided bespoke tool development is a force multiplier. In OTel, we often have lots of data, but we're still figuring out the best ways to understand it and high-fidelity data visualization remains one of the best ways to find insights. You can try out the trace visualizer example we built for this investigation and play around with it yourself.
There are a few places in the system design that can help break this cycle. Autoscaling on queue depth or concurrency rather than CPU would react to the burst in seconds rather than minutes. Longer or heavier half-open probe windows give the service a chance to warm up before the circuit breaker decides it is ready, and pre-scaling before the circuit breaker closes and normal traffic resumes achieves the same thing more deliberately. Backpressure or load-shedding at the service boundary keeps queues from running away when a sudden burst arrives. Propagating cancellations so the service stops working on a request the client has already timed out reduces the amount of wasted work that makes the avalanche worse.
Conclusion
A circuit breaker is a valuable safety mechanism as it prevents a struggling downstream service from being overwhelmed while it recovers. But it is not a self-contained solution. It makes assumptions about the environment it operates in: that probe traffic is representative of full traffic, that the protected service stays ready to receive load, that recovery is gradual rather than instantaneous. When those assumptions don't hold, the circuit breaker can become the problem rather than the solution. Knowing where those assumptions break is as important as knowing how to configure the circuit breaker itself.
We're hiring! Do you like working in an ever evolving organization such as Zalando? Consider joining our teams as a Backend Engineer!